
FIGURE 7.
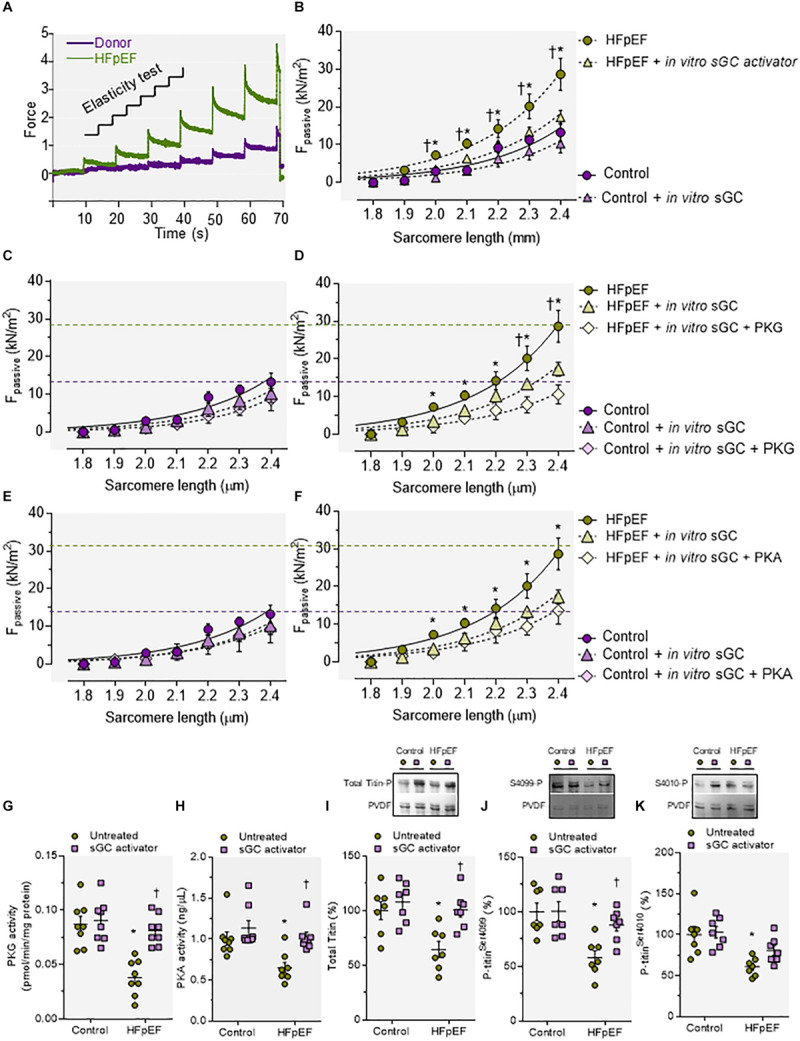
Cardiomyocyte passive stiffness; protein kinase (PK)G and PKA activities and titin phosphorylation of myocardial biopsies of human heart failure with preserved ejection fraction (HFpEF) patients before and after in vitro incubation with soluble guanylyl cyclase (sGC) activator. (A) Original recording of the force response to stepwise cell stretching of isolated skinned cardiomyocytes. (B) Control and Dahl salt-sensitive (DSS) passive force (Fpassive) at sarcomere length (SL) 1.8–2.4 μm in the presence or absence of sGC activator. (C,D) Control and DSS Fpassive at SL 1.8–2.4 μm in the presence or absence of sGC activator and subsequently added PKG. (E,F) Control and DSS Fpassive at SL 1.8–2.4 μm in the presence or absence of sGC activator and subsequently added PKA. Fit curves are two-order polynomials to the means. Data are mean ± SEM; n = 4–5/heart. For (B), *P < 0.05 control baseline versus HFpEF baseline, †P < 0.05 HFpEF baseline versus after sGC activator treatment. (D) *P < 0.05 HFpEF baseline versus HFpEF after sGC activator treatment, †P < 0.05 HFpEF after sGC activator treatment versus HFpEF after sGC activator treatment followed by PKG treatment. (F) *P < 0.05 HFpEF baseline versus HFpEF after sGC activator treatment in Student’s t-test. (G) PKG activity. (H) PKA activity. (I) Total titin phosphorylation. (J) Site-specific phosphorylation of titin-N2Bus at Ser4099. (K) Site-specific phosphorylation of titin-N2Bus at Ser4010. Data are shown as mean ± SEM; n = 7–8 left ventricular (LV) samples/group. *P < 0.05 control untreated versus HFpEF untreated and †P < 0.05 before versus after sGC activator treatment.