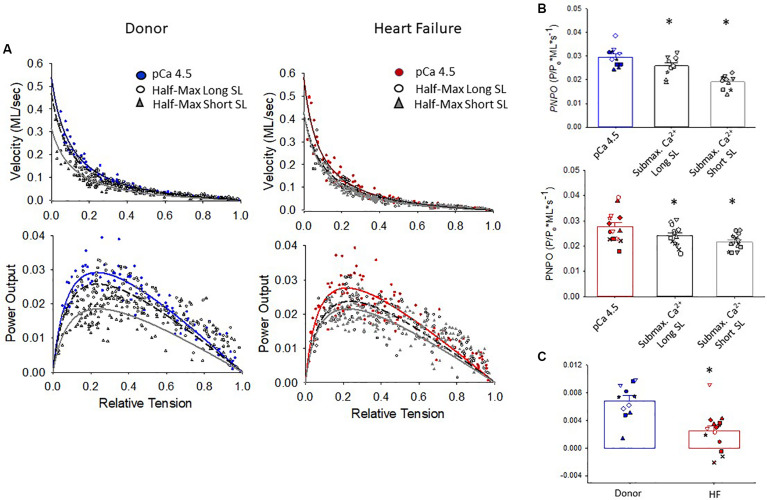
FIGURE 6.
Normalized force-velocity and power-load curves. (A) Cumulative force-velocity and power-load curves from donor and HF preparations. (B) In myocyte preparations from organ donors and patients with heart failure, the peak normalized power output (PNPO) was lower at half-maximal Ca2+ activation than at maximal Ca2+ activation (*p = 0.027 or lower depending on comparisons). (C) Sarcomere length dependence of PNPO (that is, PNPO at long SL half max – short SL half-max) was significantly reduced in failing samples, *p = 0.004. Different symbols indicate data points from each heart sample. All tests were performed using the linear mixed model.

