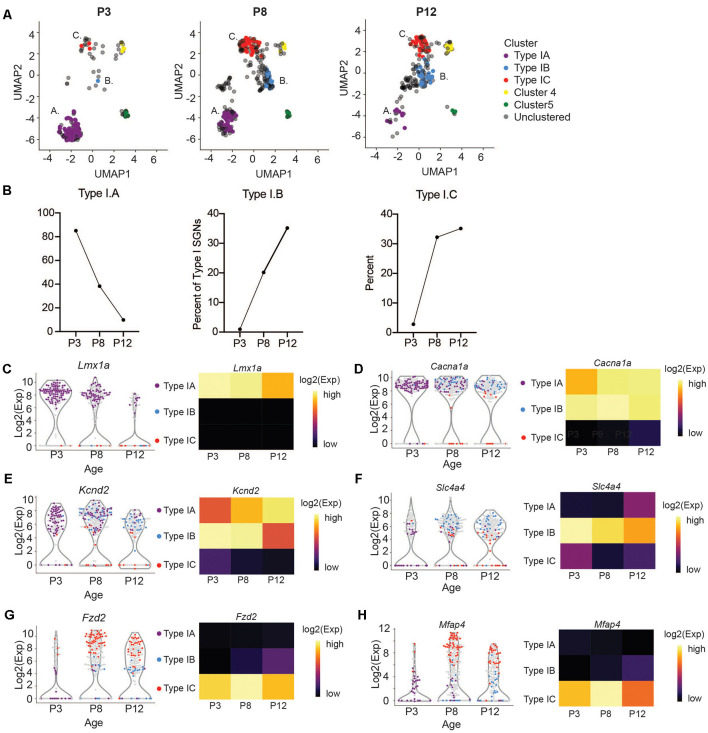
Figure 4.
Subtypes of Type I change in abundance at the onset of hearing. (A) UMAP projections of Type I SGNs colored by subtypes at postnatal days 3, 8, and 12 (n = 203 single cells at P3 and n = 230 single cells at P12, representing three independent technical runs, each with four to six animals). Postnatal day 8 is reproduced from Figure 3A for clarity. (B) Quantification of the percentage of Type IA, IB, and IC cells as a fraction of the total Type I SGNs at each age. (C–H) Violin plot of (C) Lmx1a, (D) Cacna1a, (E) Kcnd2, (F) Slc4a4, (G) Fzd2, (H) Mfap4. Each point represents a single cell, colored according to its subtype or gray if outside the IA, IB, IC. On the right, a heatmap of the same data. The expression scale is giving on the right side.

