FIGURE 1.
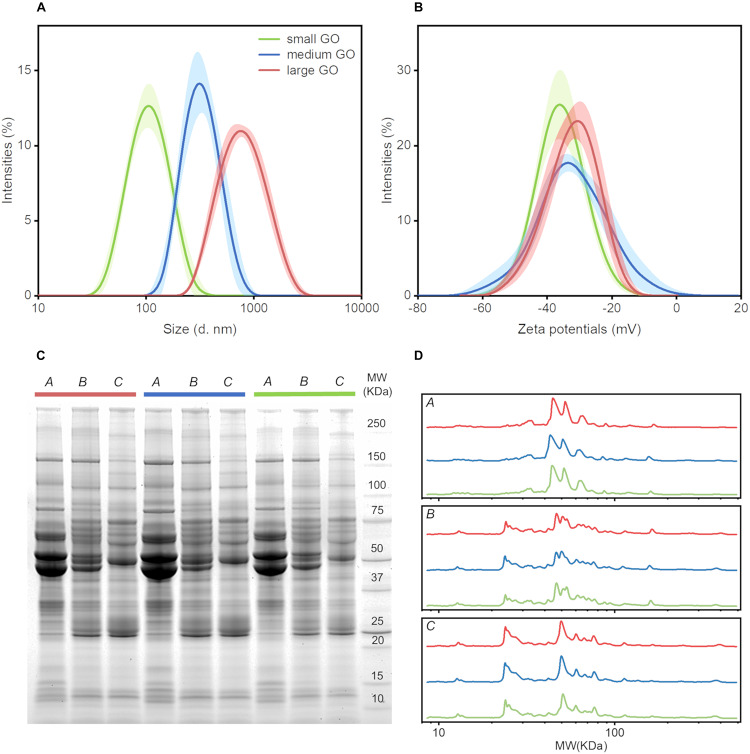
Characterization of GO nanoflakes and their interaction with human plasma (HP). (A) Size and (B) zeta-potential distributions of small, medium and large nanoflakes. (C) Representative SDS-PAGE image of PC on small, medium and large GO nanoflakes upon incubation with HP at three different dilution factors: A = 1 (i.e., undiluted HP), B = 5 and C = 10, respectively. The normalized intensity profile of each lane is reported in (D).

