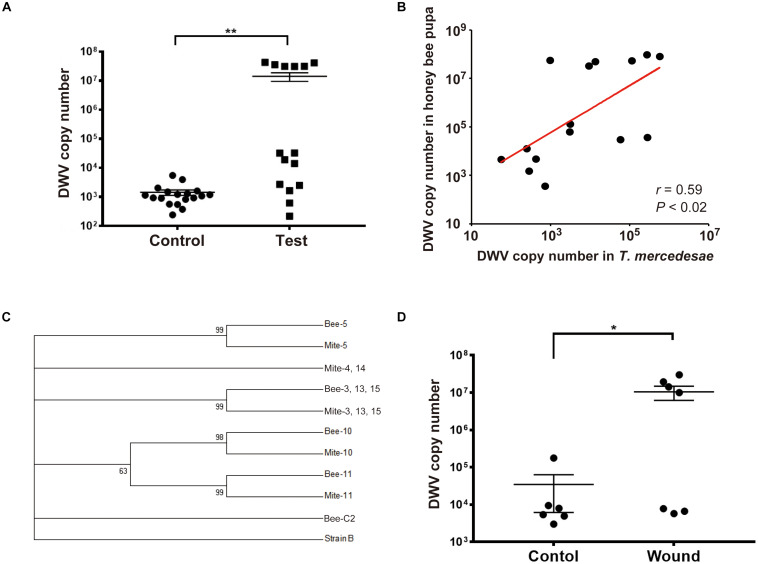
FIGURE 1.
T. mercedesae functions as a vector for DWV. (A) DWV copy numbers in the heads of honey bee pupae artificially infested by T. mercedesae (Test, n = 15) and the ones without mites (Control, n = 18). Mean values with error bars (± SEM) are indicated. Two groups are statistically different by Brunner–Munzel test (**P < 1.3E-06). (B) DWV copy numbers in individual honey bee pupae and the infesting T. mercedesae are plotted on the Y- and X-axis, respectively. The red line represents a fitted curve and the Pearson correlation value and P-value are also shown. (C) Maximum-likelihood condensed phylogeny of DWV isolates from honey bee pupae (Bee) and T. mercedesae (Mite) was constructed based on partial VP2 and VP1, and full VP4 sequences. Sequence of Bee-C2 (control pupa) sample is identical to those of other seven control pupae (Bee-C6, 9, 10, 11, 14, 15, and 16), seven test pupae (Bee-1, 4, 7, 8, 9, 12, and 14) and five infesting mites (Mite-1, 7, 8, 9, and 12). Bootstrap values are shown at the corresponding node of each branch and DWV type B strain was used as an outgroup. (D) DWV copy numbers in wounded (Wound, n = 7) and untreated (Control, n = 6) honey bee pupae. Mean values with error bars (± SEM) are indicated. Two groups are statistically different by Brunner–Munzel test (*P < 0.041).

