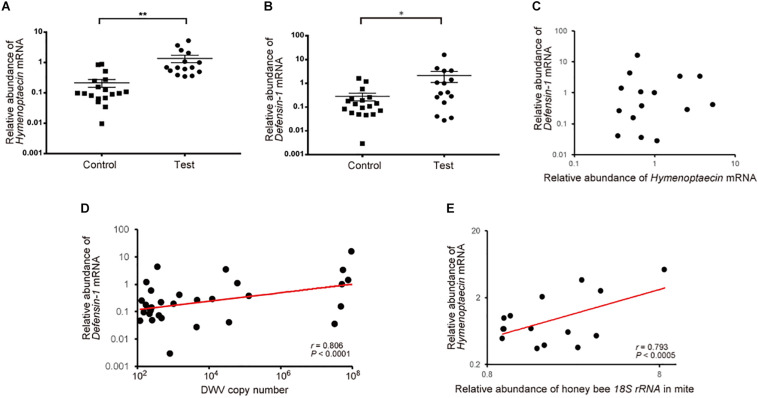
FIGURE 4.
Increase of Hymenoptaecin and Defensin-1 mRNAs by T. mercedesae infestation. Relative amounts of Hymenoptaecin (A) and Defensin-1 (B) mRNAs in honey bee pupae artificially infested by T. mercedesae (Test, n = 15) and the ones without mites (Control, n = 18). Mean values ± SEM (error bars) are shown. Brunner–Munzel test was used for the statistical analysis (Hymenoptaecin: **P < 3.1E-08; Defensin-1: *P < 0.042). (C) Relative amounts of Hymenoptaecin and Defensin-1 mRNAs in individual honey bee pupae are plotted on the X- and Y-axis, respectively. (D) DWV copy number and relative amount of Defensin-1 mRNA in individual honey bee pupae are plotted on the X- and Y-axis, respectively. The red line represents a fitted curve and the Pearson correlation value and P-value are also shown. (E) Relative amounts of Hymenoptaecin mRNA in individual honey bee pupae and honey bee 18S rRNA in the infesting mites are plotted on the Y- and X-axis, respectively. The red line represents a fitted curve and the Pearson correlation value and P-value are also shown.

