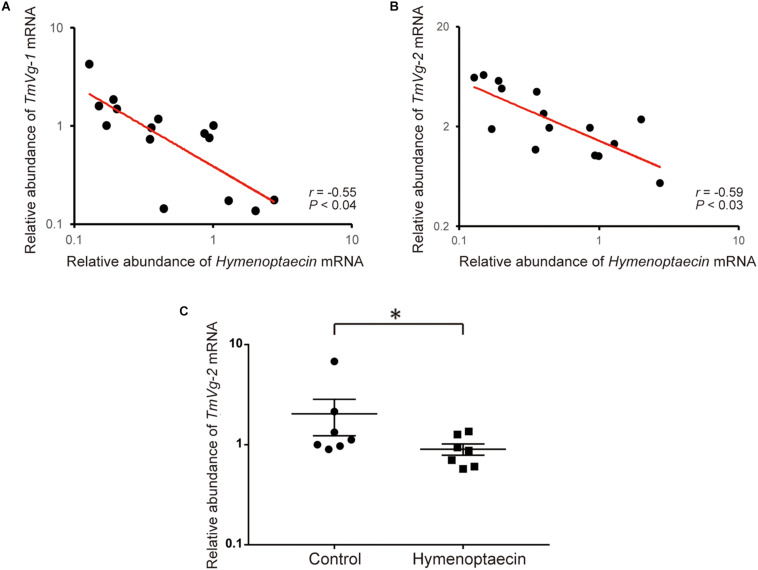
FIGURE 5.
Hymenoptaecin down-regulates T. mercedesae Vg gene. Relative amounts of Hymenoptaecin mRNA in individual honey bee pupae and TmVg-1 (A) or TmVg-2 mRNA (B) in the infesting mites are plotted on the X- and X-axis, respectively. The red line represents a fitted curve and the Pearson correlation value and P-value are also shown. (C) Relative amounts of TmVg-2 mRNA in individual mites fed with the extracts of S2 cells expressing Hymenoptaecin or wild type S2 cells (Control). Mean values ± SEM (error bars) are shown. Brunner–Munzel test was used for the statistical analysis (∗P < 0.025).

