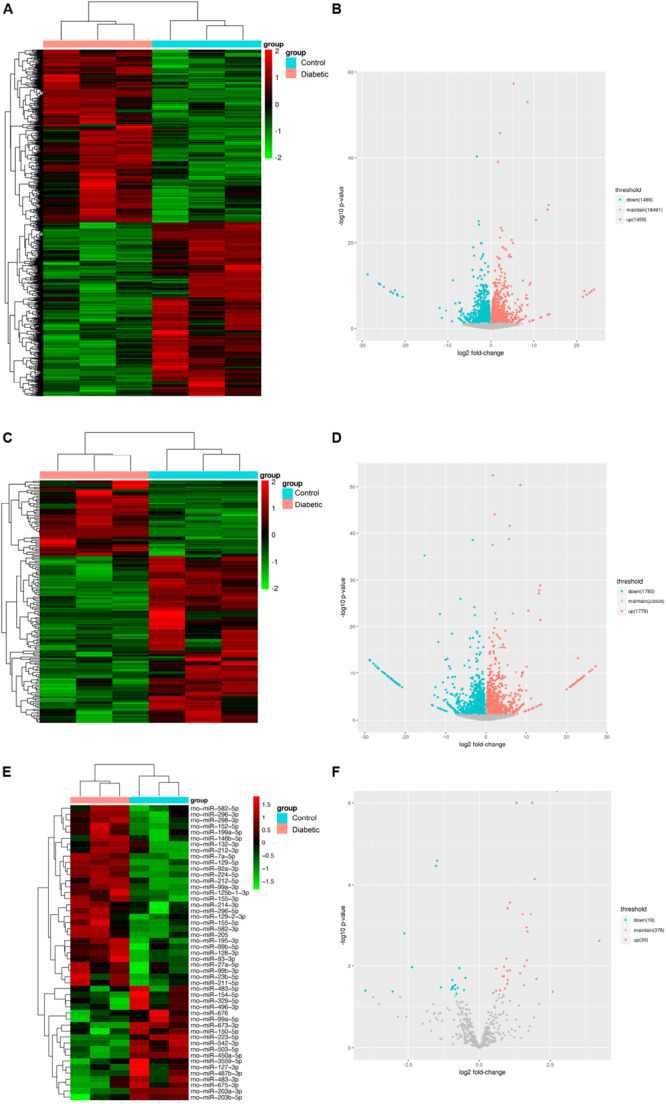
FIGURE 4.

Identification of mRNAs, lncRNAs, and miRNAs differentially expression in Schwann cells from streptozotocin (STZ)-treated rats and control rats. Hierarchical clustering analysis showed all differentially expressed mRNAs (A), lncRNAs (C), and miRNAs (E). Red color represented relatively high expression and green color represents relatively low expression. Volcano plots of normalized expression levels for differentially expressed mRNAs (B), lncRNAs (D) and miRNAs (F). The red points in the plots represented the upregulated RNAs with statistical significance and the blue points in the plots represented the downregulated RNAs with statistical significance (P-value < 0.05 and fold change > 1.2 or <0.83).
