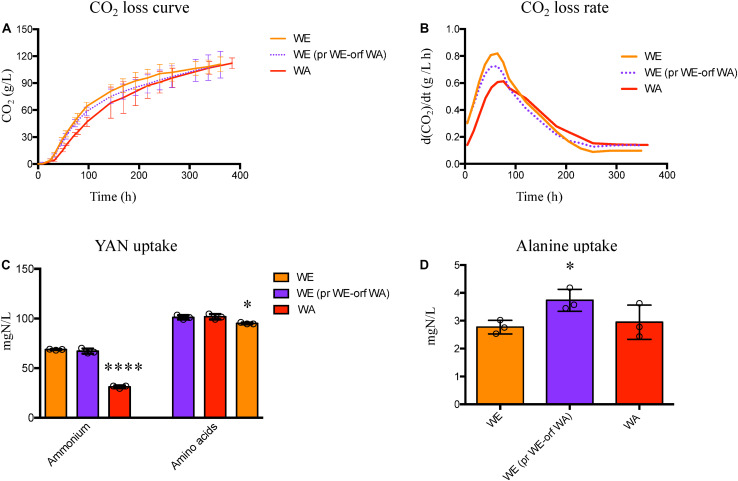
FIGURE 6.
Fermentation performance for the WE strain with GTR1 allele swapping. (A) Fermentative performance was evaluated by CO2 loss over the time and the kinetic parameters were extracted from the curves. (B) Maximum CO2 loss rate was determined by calculating the first derivate of the CO2 loss curve. (C) Ammonium and amino acids consumption for the WE strain with GTR1 ORF swapping and the wild type parental strains. (D) Alanine consumption for the WE strain with GTR1 ORF swapping and the wild type parental strains. Plotted values correspond to the average of three biological replicates (dots), with their standard error represented by bars (mean ± SE). The asterisks represent different levels of significance between the phenotypes of strains constructed and wild type strains (t-test; *p < 0.05 and ****p < 0.0001). WE, Wine/European; WA, West African; pr, Promoter; orf: Open Reading Frame (ORF).

