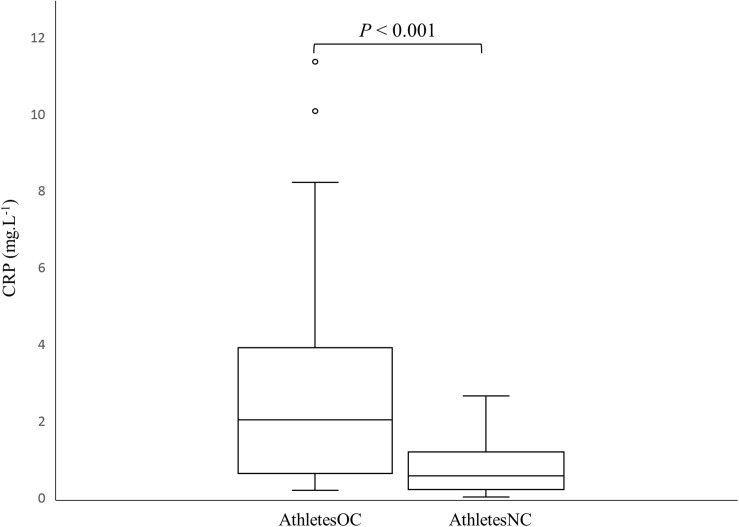
FIGURE 1.
Box and whisker plot of C-reactive protein (CRP) concentrations in AthletesNC and AthletesOC. The boxes span the interquartile range (IQR), the line depicts the median value, the whiskers represent the highest and lowest values within a 1.5 IQR of the nearest quartile, and the circles depict the outliers.

