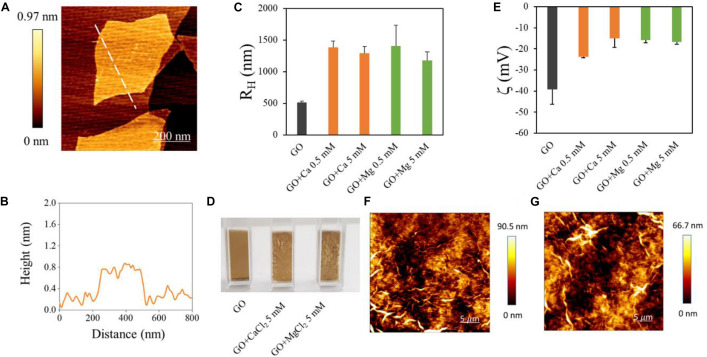
FIGURE 1.
Characterization of GO samples used and of GO interaction with divalent cations. (A) AFM representative image of GO flake and a height profile obtained along the dashed line (B). Hydrodynamic radius of GO samples in different solutions obtained by DLS (C). Photographs of cuvettes containing GO in different solutions (D). Zeta potential of GO in different solutions (E). Representative images of GO aggregates in Ca2+ (F) or Mg2+ (G) obtained by AFM.

