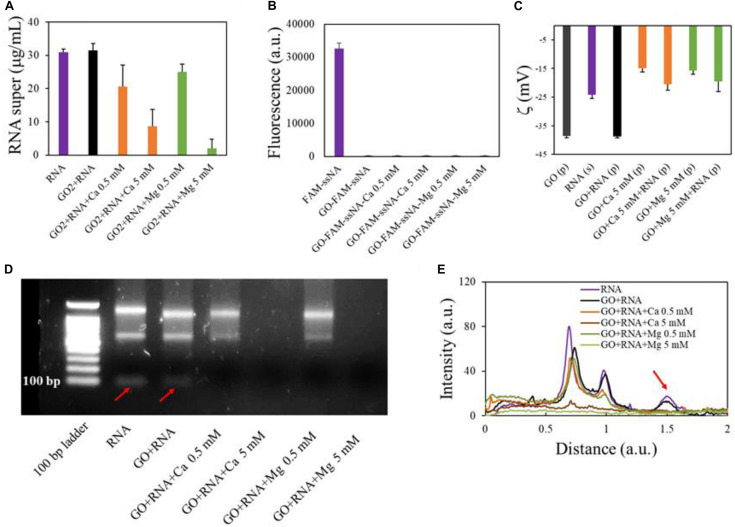
FIGURE 3.
Analysis of GO binding with total RNA. Concentration of RNA in supernatants after interaction with GO or GO and cations measured by UV spectroscopy (A). Quantification of fluorescent FAM-ssNA in supernatants after interaction with GO (B). Zeta potential of GO samples after RNA adsorption in different conditions (C). Electrophoretic analysis of supernatants after interaction with GO (D) and line profile analysis of gels (E) with red arrow highlighting small RNA peak (corresponding to the band under 100 bases).

