Figure 5.
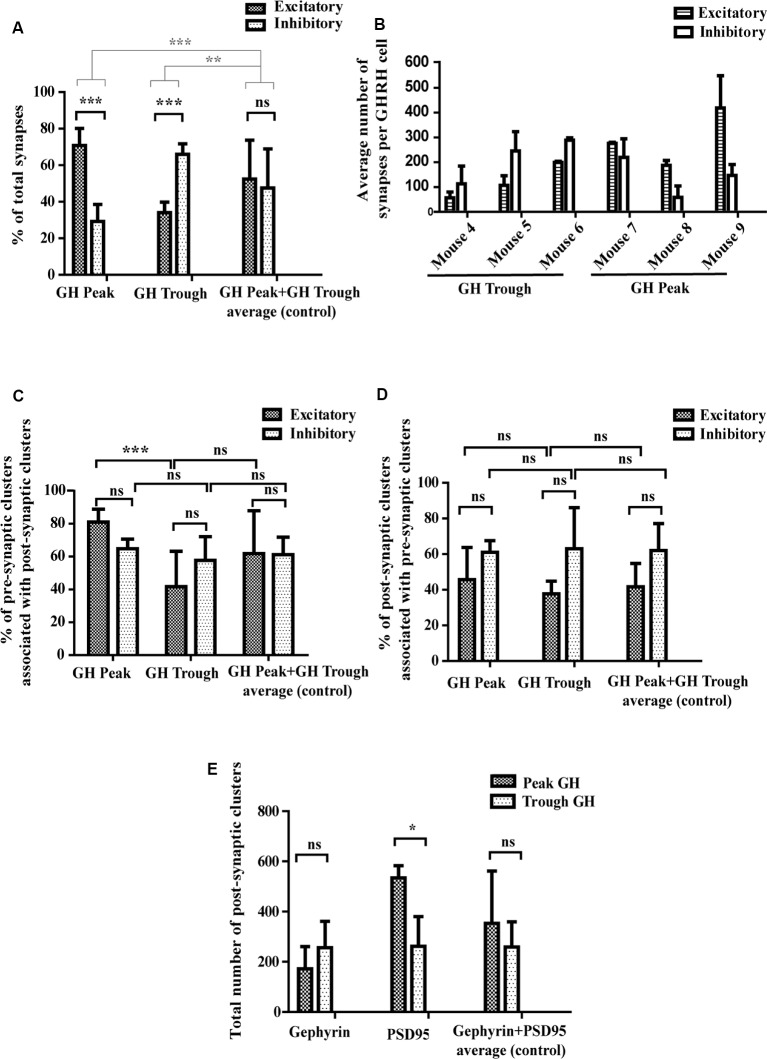
Quantitative assessment of synaptic parameters. (A) Synapse numbers during peaks and troughs of GH secretion. During high hormone levels (“GH Peak”), 69% of all synapses are excitatory and 31% are inhibitory. During low hormone levels (“GH Trough”), 34% of all synapses are excitatory and 66% inhibitory. There is no significant difference in the percent of excitatory and inhibitory synapses in the control condition (“GH Peak+GH Trough”). Black significance bars represent the change in synapse numbers (as % of total synapses) between the three conditions. Gray significance bars represent the significance levels of the percent change of excitatory and inhibitory synapse numbers at GH Peak and GH Trough as compared to the percent change of the average (control). Black significance bars: ANOVA-2 p(interaction) < 0.001; after Bonferroni post hoc test correction p(GH Peak) < 0.001, p(GH Trough) < 0.001. Gray significance bars: ANOVA-1 p < 0.001; after Tukey post hoc test p(percent change GH Peak vs. percent change Average) < 0.001, p(percent change GH Trough vs. percent change Average) = 0.005. (B) Absolute synapse numbers in each mouse per GHRH cell. Although numbers of excitatory and inhibitory synapses varied between mice [excitatory synapse numbers ranged from 45 (in mouse 4) to 372 (in mouse 9) and inhibitory synapse numbers ranged from 47 (in mouse 8) to 255 (in mouse 6)], the ratios of excitatory to inhibitory synapses between each mouse were more conserved. Data displayed as means ± SD. (C) Synapse-forming pre-synaptic clusters. During GH Peak, 81% of excitatory pre-synaptic clusters are associated with excitatory post-synaptic clusters, forming a synapse (the remaining 19% are “free” pre-synaptic clusters). This changes during GH Trough, where only 41% of pre-synaptic clusters are associated with post-synaptic clusters (the remaining 59% are “free” pre-synaptic clusters). This is not seen in inhibitory clusters, where levels remain similar (65% of pre-synaptic clusters associate with post-synaptic clusters during peaks and 58% during troughs). No change is observed in the control data. ANOVA-2 p(GH Peak vs. GH Trough) < 0.001; after Bonferroni post hoc test correction p(GH Peak Excitatory vs. GH Trough Excitatory) < 0.001. (D) Synapse-forming post-synaptic clusters. No significant difference was found between the percent of post-synaptic clusters that associate with pre-synaptic clusters to form synapses during GH Peak and GH Trough. ANOVA-2 p(Excitatory vs. Inhibitory) = 0.008; after Bonferroni post hoc test correction p(all factors) > 0.62. However, the absolute number of post-synaptic excitatory PSD95 clusters increased during GH Peak levels from an average of 262–534 clusters, as presented in (E) with ANOVA-2 p(GH Peak vs. GH Trough) = 0.03; after Bonferroni post hoc test correction p(PSD95 GH Peak vs. PSD95 GH Trough) = 0.02. No changes were seen in the control data, in both (D,E). All data is displayed as means ± SD using two-way ANOVA with significance values at 0.12 (ns), 0.033 (*), 0.002 (**), <0.001 (***).

