FIGURE 2.

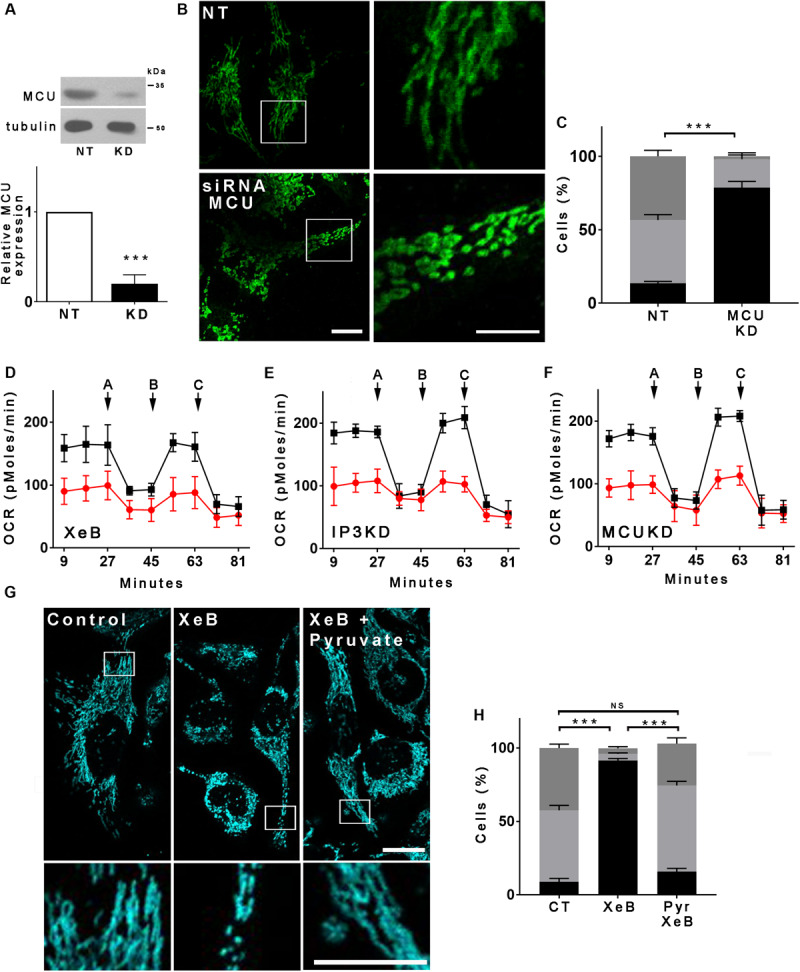
The bioenergetic stress caused by the inhibition of IP3R-mediated Ca2+ transfer to the mitochondria is responsible for the mitochondrial network fragmentation. (A) Representative Western blot of MCU in HeLa cells transfected with a siRNA against MCU (KD) or a non-target (NT) siRNA as control. Bar graph: MCU/tubulin expressed as average fold increase over basal levels (control cells, NT). Mean ± SEM of 3 independent experiments with 4 replicates each. ***P < 0.001 compared to control. (B) Confocal images of Hela cells transfected with siRNA for MCU (KD) or a non-target (NT) siRNA as control for 72 h and immunostained with anti-TOMM20 to detect the mitochondrial network. Bar: 10 μm. (C) Mitochondrial morphology analysis of MCU knockdown (KD) cells on (B); Fragmented (black), ≤1 μm, medium (light gray), ≥1 and ≤4 μm, networked (dark gray), ≥4 μm. (D–F) Basal and maximum oxygen consumption rate (OCR) determined by Seahorse after the addition of oligomycin (a), FCCP (b), and rotenone (c) in HeLa cells treated with XeB or knockdown (KD) for IP3Rs or MCU. (G) Confocal images of Hela cells treated with 5 μM XeB for 60 min in the presence of methyl-pyruvate immunostained with anti-TOMM20 to detect the mitochondrial network. Bar: 10 μm. (H) Mitochondrial morphology analysis of MCU knockdown (KD) cells on (B); Fragmented (black), ≤1 μm, medium (light gray), ≥1 and ≤4 μm, and networked (dark gray), ≥4 μm. Data represent mean ± SEM of 3 independent experiments. In each experiment 150 cells/condition were scored. ***p < 0.001. ns, not significant.
