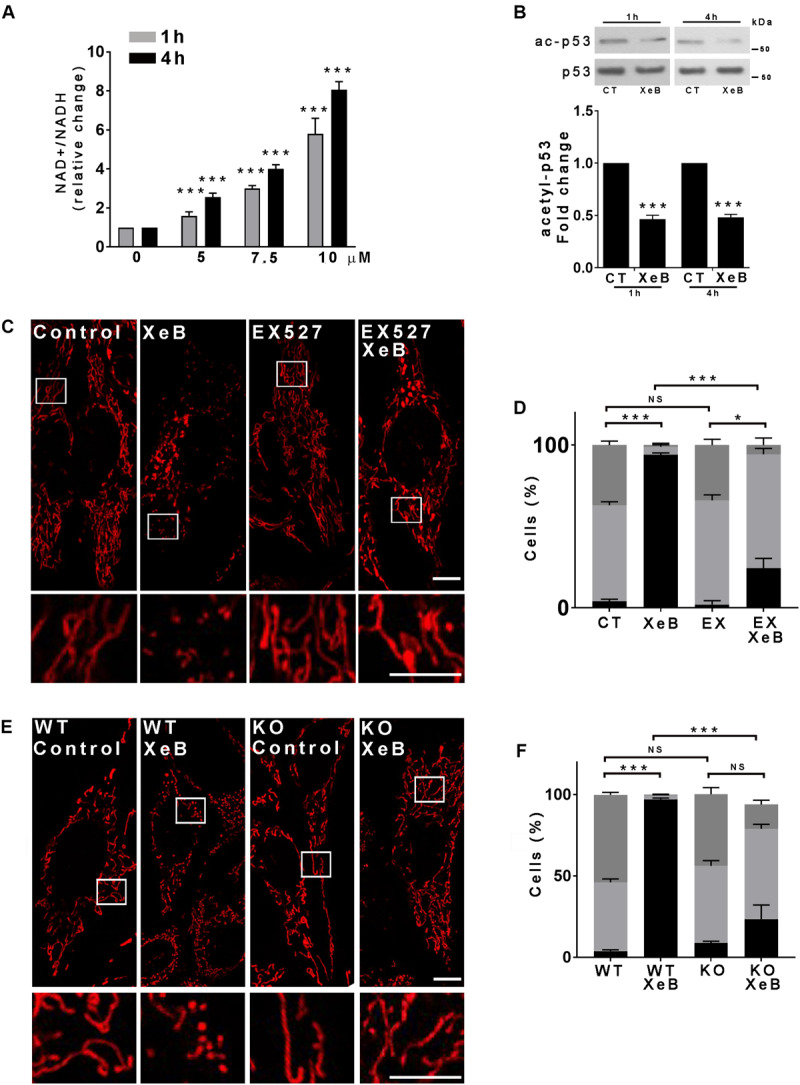
FIGURE 3.

The activation of SIRT1 is necessary for the mitochondrial fragmentation induced by inhibition of IP3R-mediated Ca2+ transfer to the mitochondria. (A) Inhibition of IP3R with increasing concentrations of XeB for 1 and 4 h increases the NAD/NADH ratio in HeLa cells. (B) Representative Western blots of acetylated p53 (ac-p53) and p53 as loading control after inhibition of IP3R with 5 μM XeB for 1 and 4 h. Bar graph: ac-p53/p53 expressed as average fold increase over basal levels (control cells, CT). Mean ± SEM of 4 independent experiments with 3 replicates each. ***P < 0.001 compared to control. (C) Confocal images of Hela cells labeled with 8 nM TMRE to visualize mitochondria simultaneously treated with 5 μM XeB for 4 h and the SIRT1 inhibitor EX527 (12.5 μM). Bar: 10 μm. (D). Mitochondrial morphology analysis of HeLa cells simultaneously treated with 5 μM XeB for 4 h and the SIRT1 inhibitor EX527 (12.5 μM) (C); Fragmented (black), ≤1 μm, medium (light gray), ≥1 and ≤4 μm, networked (dark gray), ≥4 μm. Data represent mean ± SEM of 3 independent experiments. In each experiment 150 cells/condition were scored. ***p < 0.001. ns, not significant. (E) Confocal images of SIRT1 knockout (KO) MEF cells labeled with 8 nM TMRE to visualize mitochondria treated with 5 μM XeB for 4 h. Bar: 10 μm. (F) Mitochondrial morphology analysis of SIRT1 KO MEF cells treated with 5 μM XeB for 4 h (E); Fragmented (black), ≤1 μm, medium (light gray), ≥1 and ≤4 μm, networked (dark gray), ≥4 μm. Data represent mean ± SEM of 3 independent experiments. In each experiment 150 cells/condition were scored. ***p < 0.001. ns, not significant.
