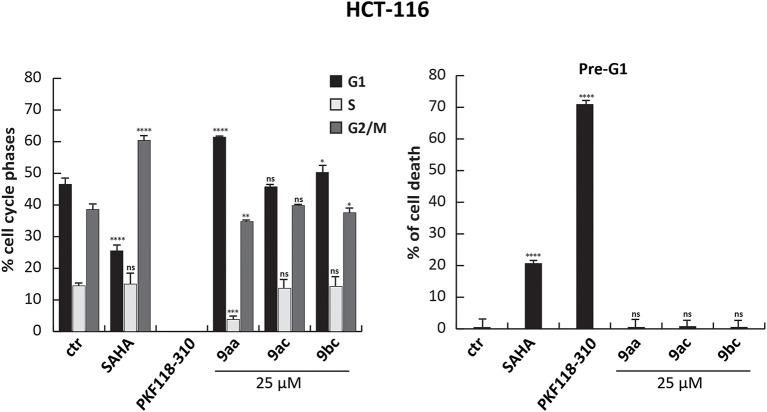
Figure 4.
Cell cycle analysis of 9aa, 9ac, and 9bc. HCT-116 cells were treated with 9aa, 9ac, and 9bc for 24 h at 25 μM. SAHA and PKF118-310 (5) were used as positive controls for 24 h at 5 and 10 μM, respectively. Left panel shows the percentage of cell cycle phases and right panel shows the percentage of cell death evaluated by propidium iodide. The analysis was performed using ModFit v3 software. ****p-value ≤ 0.0001, ***p-value ≤ 0.001, **p-value ≤ 0.01, *p-value ≤ 0.05, nsp-value > 0.05 vs control cells.

