Table 2.
Performance of classification and regression models for each learning task (LT).
| LT | Target | Target distribution | Method | Accuracy [%] | Sens. ♀[%] | Sens. ♂[%] |
|---|---|---|---|---|---|---|
| 1 | Gender | 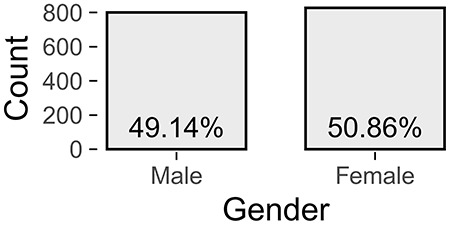 |
RIDGE | 72.19 ± 2.94* | 71.41 ± 5.46 | 73.02 ± 4.30 |
| SVM | 71.82 ± 3.66* | 70.93 ± 5.17 | 72.70 ± 6.00 | |||
| LASSO | 71.33 ± 3.03* | 69.49 ± 4.23 | 73.19 ± 4.88 | |||
| GBT | 70.35 ± 3.36* | 70.91 ± 5.05 | 69.72 ± 6.20 | |||
| RF | 68.63 ± 5.24* | 68.67 ± 5.95 | 68.58 ± 7.14 | |||
| LT | Subset | Target | Target distribution | Method | RMSE | R2 |
| 2a | only ♀ | TQ_distress (T0) | 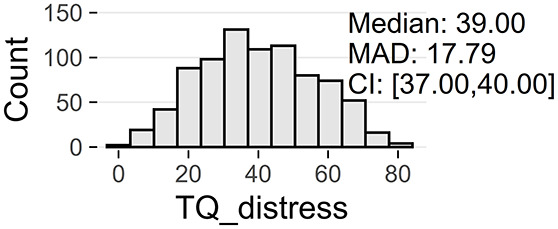 |
GBT | 10.92 ± 0.68* | 0.55 ± 0.04 |
| RF | 11.38 ± 0.74* | 0.51 ± 0.05 | ||||
| LASSO | 11.55 ± 0.70* | 0.50 ± 0.04 | ||||
| RIDGE | 11.59 ± 0.63* | 0.50 ± 0.04 | ||||
| SVM | 11.97 ± 0.51* | 0.46 ± 0.03 | ||||
| 2b | only ♂ | TQ_distress (T0) | 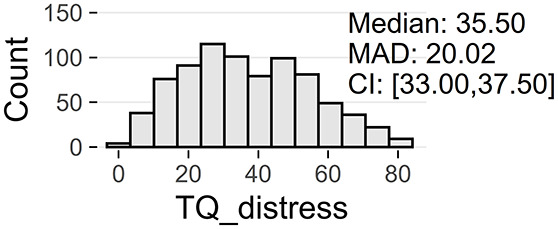 |
GBT | 10.11 ± 1.12* | 0.68 ± 0.06 |
| RF | 10.58 ± 1.01* | 0.65 ± 0.06 | ||||
| LASSO | 10.59 ± 0.98* | 0.65 ± 0.05 | ||||
| RIDGE | 10.72 ± 1.05* | 0.64 ± 0.06 | ||||
| SVM | 11.21 ± 1.02* | 0.61 ± 0.06 | ||||
| 3a | only ♀ | ADSL_depression | 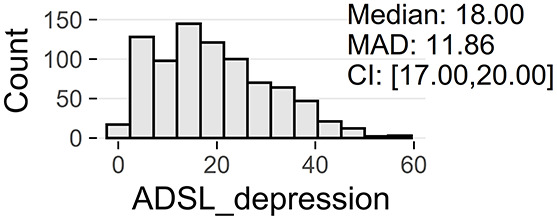 |
LASSO | 5.80 ± 0.73* | 0.74 ± 0.06 |
| (T0) | GBT | 5.88 ± 0.65* | 0.74 ± 0.06 | |||
| RF | 6.02 ± 0.62* | 0.72 ± 0.05 | ||||
| GBT | 6.10 ± 0.65* | 0.72 ± 0.06 | ||||
| SVM | 6.12 ± 0.72* | 0.71 ± 0.06 | ||||
| 3b | only ♂ | ADSL_depression | 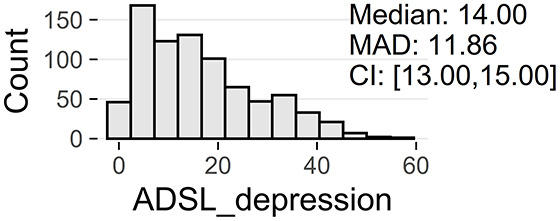 |
LASSO | 5.10 ± 0.38* | 0.81 ± 0.03 |
| (T0) | RIDGE | 5.14 ± 0.38* | 0.80 ± 0.03 | |||
| GBT | 5.16 ± 0.42* | 0.80 ± 0.04 | ||||
| SVM | 5.29 ± 0.38* | 0.79 ± 0.03 | ||||
| RF | 5.29 ± 0.46* | 0.79 ± 0.04 | ||||
| 4a | only ♀ | Treatment effect | 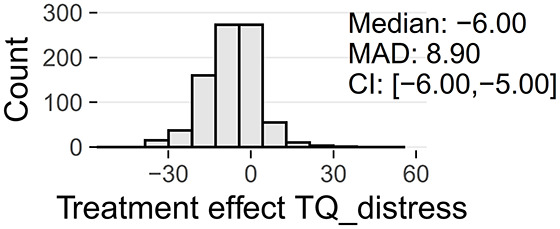 |
RF | 9.55 ± 0.84 | 0.02 ± 0.09 |
| TQ_distress | RIDGE | 9.58 ± 0.82 | 0.01 ± 0.09 | |||
| (T0 → T1) | GBT | 9.59 ± 0.82 | 0.01 ± 0.08 | |||
| LASSO | 9.61 ± 0.82 | 0.01 ± 0.08 | ||||
| SVM | 9.64 ± 0.83 | 0.00 ± 0.09 | ||||
| 4b | only ♂ | Treatment effect | 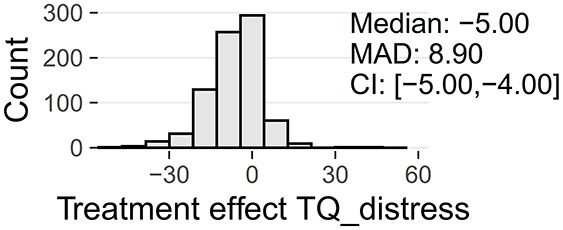 |
RF | 9.34 ± 1.31 | 0.04 ± 0.14 |
| TQ_distress | LASSO | 9.41 ± 1.34 | 0.03 ± 0.14 | |||
| (T0 → T1) | RIDGE | 9.43 ± 1.31 | 0.03 ± 0.14 | |||
| GBT | 9.54 ± 1.32 | 0.00 ± 0.14 | ||||
| SVM | 9.55 ± 1.36 | 0.00 ± 0.14 | ||||
| 5a | only ♀ | Treatment effect | 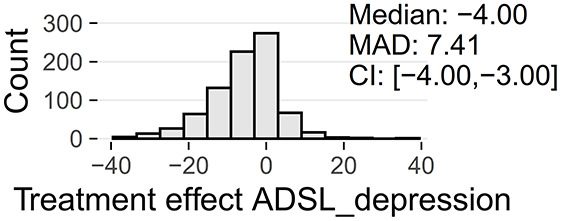 |
LASSO | 8.21 ± 0.77 | 0.14 ± 0.09 |
| ADSL_depression | RIDGE | 8.21 ± 0.80 | 0.14 ± 0.09 | |||
| (T0 → T1) | RF | 8.23 ± 0.73 | 0.13 ± 0.08 | |||
| SVM | 8.26 ± 0.84 | 0.13 ± 0.10 | ||||
| GBT | 8.26 ± 0.77 | 0.13 ± 0.09 | ||||
| 5b | only ♂ | Treatment effect | 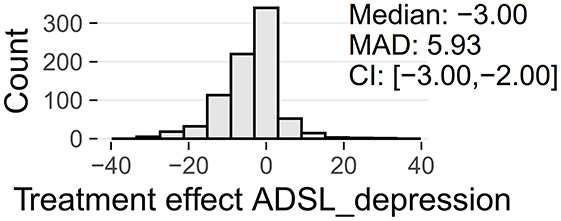 |
GBT | 6.79 ± 0.73 | 0.17 ± 0.10 |
| ADSL_depression | RF | 6.82 ± 0.68 | 0.16 ± 0.09 | |||
| (T0 → T1) | RIDGE | 6.84 ± 0.73 | 0.16 ± 0.10 | |||
| LASSO | 6.85 ± 0.71 | 0.15 ± 0.10 | ||||
| SVM | 7.15 ± 0.64 | 0.08 ± 0.09 |
Performance values are cross-validation mean ± SD. Algorithms are sorted by primary performance measure, i.e., accuracy for LT1 and RMSE for LT2-5. Asterisks signify models with significantly better cross-validation performance compared to the baseline w.r.t. the primary performance measure (α = 0.05). A bar chart (LT1) and histograms (LT2-5) illustrate the distribution of the target variables. For the numerical targets, median, median absolute deviation (MAD), and 95% bootstrap confidence interval (CI) are depicted.
