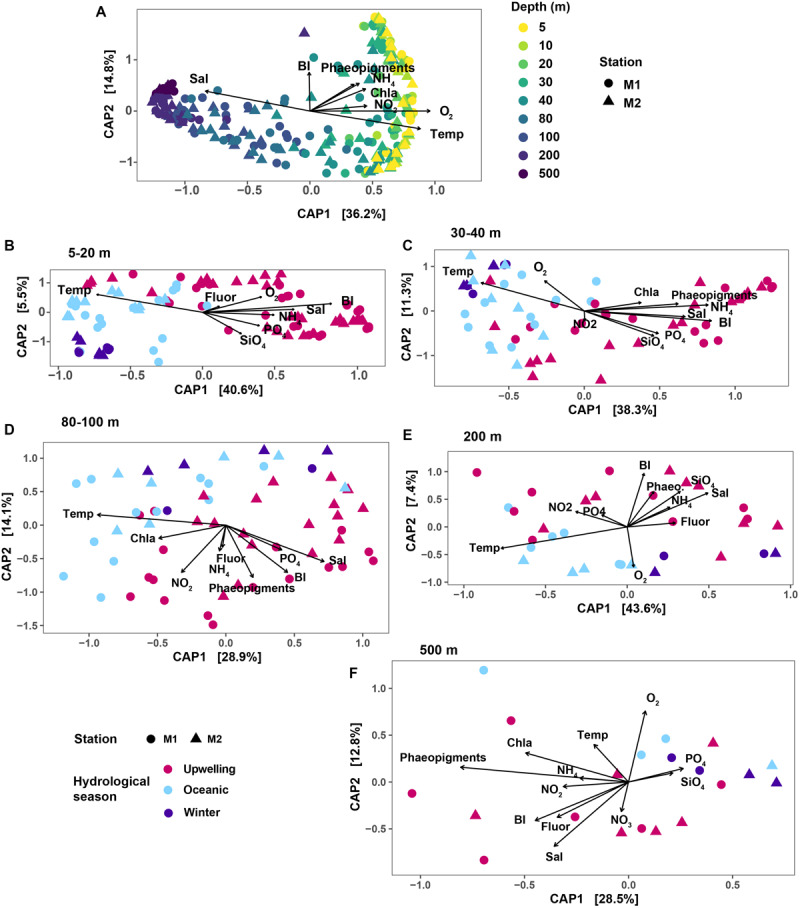
FIGURE 2.

Results of CAP ordination analysis, relating SV abundances to measured environmental variables. In each plot panel, shapes correspond to the two stations. (A) CAP results on the overall dataset; colors indicate the various depths sampled. Remaining panels show results of CAP ordination on depth-subsetted data: (B) 5–20 m; (C) 30 and 40 m depths; (D) 80 and 100 m; (E) 200 m and (F) 500 m. In (B–F), color mapping corresponds to the three hydrographic seasons in MB. The Bakun upwelling index was used as a proxy for bay seasonality. Variable abbreviations: BI, Bakun upwelling index; Chla, chlorophyll a; Fluor, fluorescence; Sal, salinity; Temp, temperature; Phaeo, phaeopigments.
