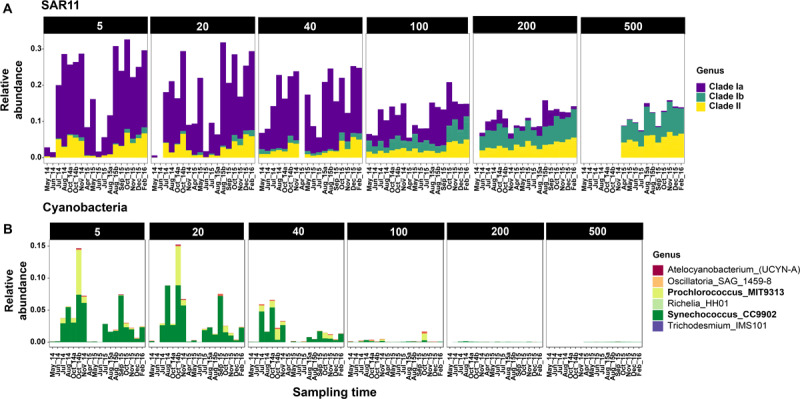
FIGURE 4.

Relative abundances of SAR11 (A) and Cyanobacteria (B) clades across sampling time points at Station M1. Only selected depths are shown. Complete depth profiles for both stations are presented in Supplementary Figure S6 (SAR11) and Supplementary Figure S7 (Cyanobacteria). Note that the winter months in 2014 were not sampled due to logistical reasons.
