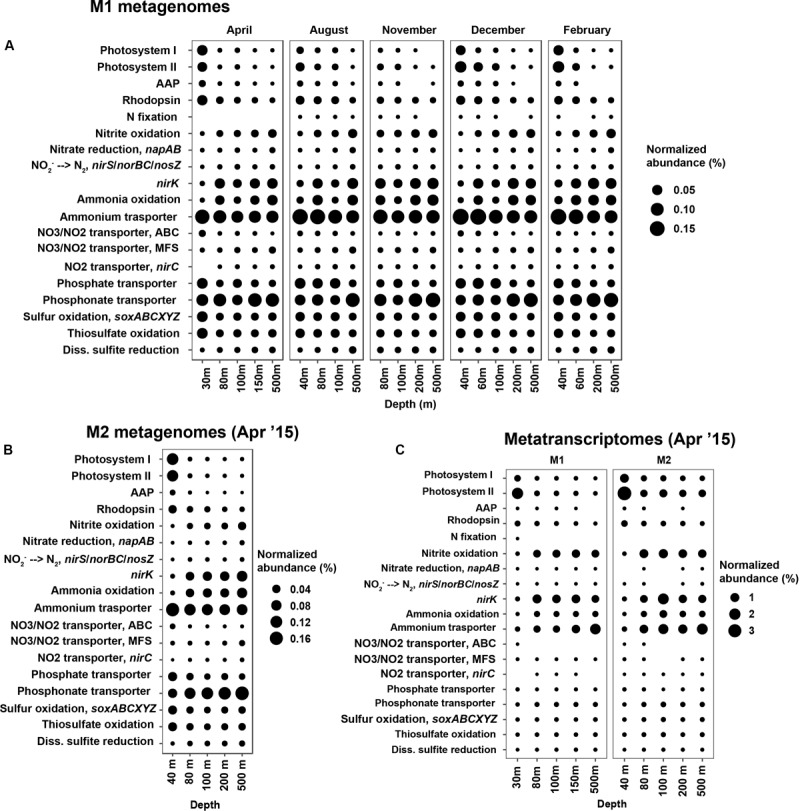
FIGURE 5.

Normalized abundances of selected metabolic pathways/genes in the metagenomes and metatranscriptomes. Both color and size mapping correspond to the normalized abundance of each pathway or gene. (A) metagenomes from station M1, all collected in 2015; (B) metagenomes from station M2, representative of the upwelling season; and (C) metatranscriptomes from M1 and M2, collected during the upwelling season in April 2015. KO terms used for estimating relative abundances of each pathway are presented in Supplementary Table S1. Pathway/gene abbreviations: AAP, aerobic anoxygenic photosynthesis, nirK, nitrite redcutase.
