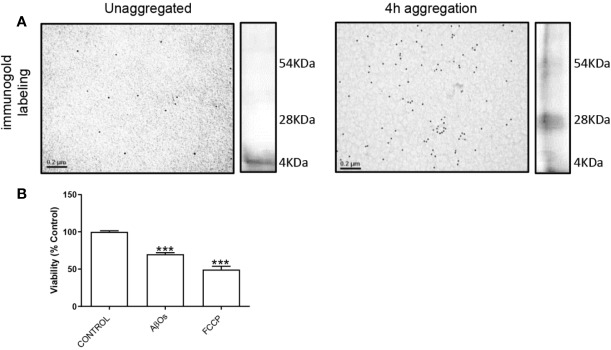
Figure 1.
Characterization of AβOs. (A) Microscopy electronic of Aβ1–40 peptide. Aβ1–40 peptide was aggregated 4 h and was exposure to colloidal gold particles (10 nm) conjugated with a β amyloid Antibody (MOAB-2). Aβ1–40 peptide aggregation is visualized by silver staining to the right side of each panel. (B) PC-12 cells were incubated with AβOs 0.5 µM for 24 h and FCCP (10 µM). Data are represented as mean ± SEM. ***p < 0.001 compared between the control group. One-way ANOVA used for all statistical analyses. FCCP, Carbonyl cyanide-4-trifluoromethoxy) phenylhydrazone. (n=3–5 for each group).

