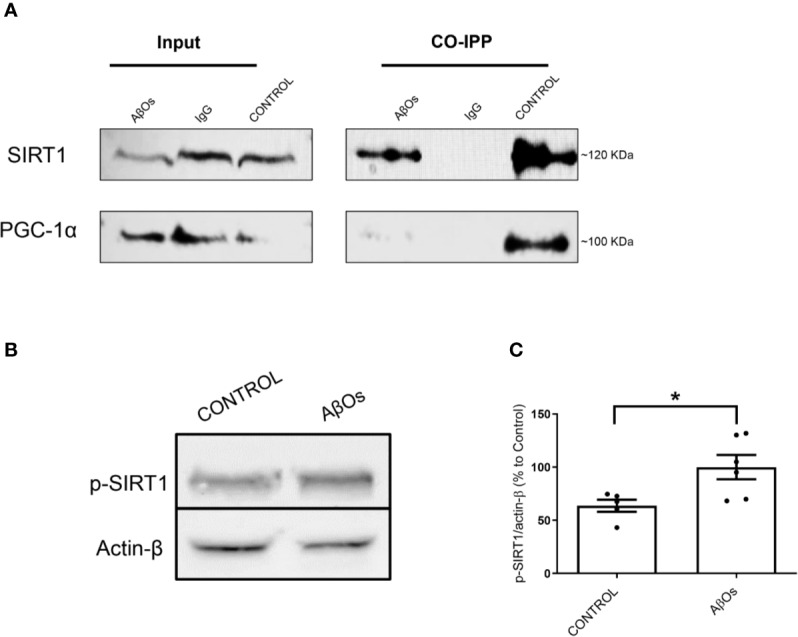
Figure 9.

Changes in interaction between the PGC-1α/SIRT1 and association with the levels of p- SIRT1 after chronic treatment with AβOs. (A) Representative western blot for PGC-1α (91 kDa) and SIRT1 (120 kDa) in PC-12 cells in control condition (Iane 1) and after chronic treatment with AβOs (0.5 μM; Iane 3). Lane 2 is the IgG control. Co-immunoprecipitation of SIRT1 with PGC-1α are shown in lanes 4, where we can see untreated cells, lane 5 corresponds a IgG control, and lane 6 corresponds to AβOs treatment (B) western blot of whole cell lysates of PC12 cells treated with AβOs (0.5 μM) for 24 h showing p-SIRT1 levels. (C) Quantification of p-SIRT1 levels normalized to β actin. Data are represented as mean ± SEM. *p < 0.05, compared between the control group. Student's t-test followed by unpaired t-test was used for all statistical analyses. PGC-1α, Peroxisome proliferator- activated receptor gamma coactivator 1-alpha; SIRT1, silent information regulator 2 homolog 1 (n=3/group) (Original blots are provided in Supplementary Figure 9).
