Figure 1.
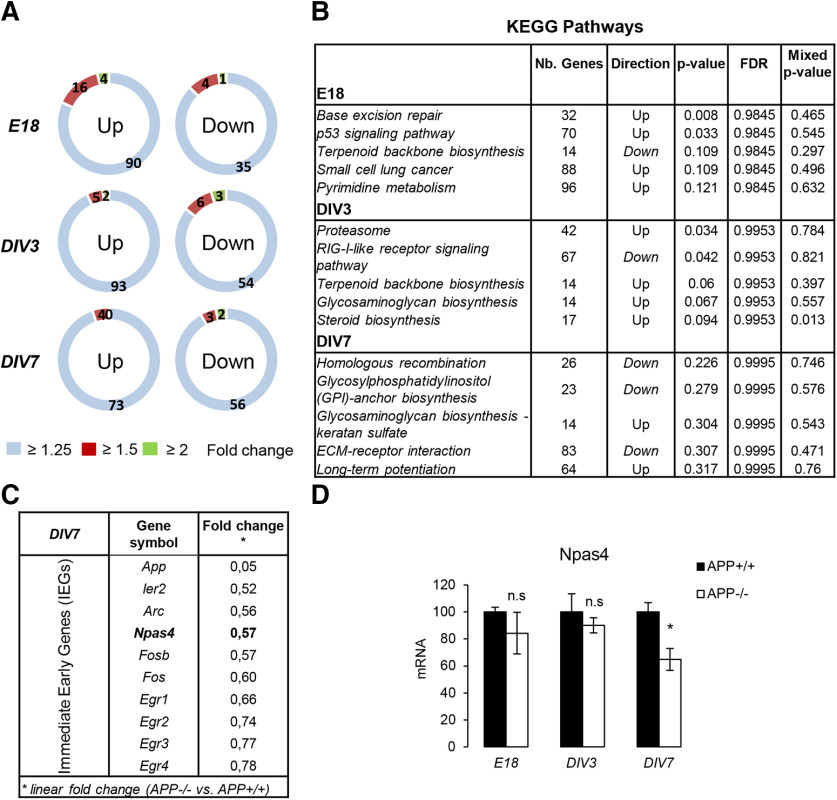
APP-dependent expression of NPAS4 in young differentiating neuronal culture. Summary of transcriptome analysis performed with the GeneChip Mouse Transcriptome Array 1.0 (Affymetrix). The characterization of the model and the experimental workflow are described in Extended Data Figure 1-1. Data were processed in triplicate (N = 3) for each experimental time point (E18, DIV3, DIV7). Non-coding transcripts and alternative splicing products were detected by these arrays, but only transcripts of coding transcripts have been considered here. For all the transcripts, adjusted p > 0.05 except for APP (internal control, p < 0.05). A, Number of upregulated and downregulated coding transcript in APP−/− versus APP+/+ primary neurons at E18, DIV3, and DIV7. Linear fold changes have been set at 1.25, 1.5, and 2. B, KEGG pathway analysis (http://www.genome.jp/kegg/pathway.html) at E18, DIV3, DIV7 (APP−/− vs APP+/+) to identify networks molecular pathways (or interaction networks) in which differentially expressed genes are clustered. The five most modified pathways are displayed for each time point, with the number of genes potentially lated or downregulated. C, IEGs expression in APP−/− versus APP+/+ primary neurons at DIV7 and their respective fold change (APP−/− vs APP+/+) in microarray analysis at DIV7. D, Neuronal PAS 4 domain (NPAS4) mRNA level was measured by qPCR at E18, DIV3, and DIV7 (n = 6, N = 3). Results (mean ± SEM) are expressed as percentage of controls (APP+/+); n.s. = non-significant, *p = 0.0242, Student’s t test. mRNA levels of two other IEGs (Egr1 and Egr3) were measured in the same conditions (Extended Data Figure 1-2).

