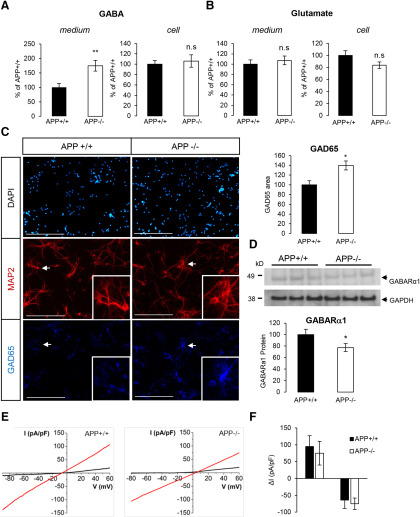
Figure 5.
GABAergic markers and GABAergic transmission in APP knock-out neurons. A, Quantification of GABA in culture medium and cell extracts of APP+/+ and APP−/− primary neurons at DIV7. Results (mean ± SEM) are expressed as percentage of APP+/+ (n = 20, N = 3); **p = 0.0024, n.s. = non-significant, Student’s t test. B, Quantification of glutamate in culture medium and cell extracts of APP+/+ and APP−/− neurons at DIV7. Results (mean ± SEM) are expressed as percentage of APP+/+ (n = 16, N = 3); n.s. = non-significant, Student’s t test. Glutamate responses measured in APP−/− neurons are shown in Extended Data Figure 5-1. C, Cortical APP+/+ and APP−/− neurons at DIV7 were immunostained for the neuron-specific marker MAP2 and GAD65. Arrows indicate MAP2/GAD65-positive neurons, shown at higher magnification (insets). The expression profile of the GAD65 GABAergic marker in APP+/+ and APP−/− neurons is detailed in Extended Data Figure 5-2. GAD65 signal (five fields per coverslip) was normalized for quantification to the number of cells in the area (histogram on the right). At least two coverslips were quantified for each group (APP+/+ and APP−/−) in two independent experiments (N = 2). Results (mean ± SEM) are given as percentage of control (APP+/+). Scale bar: 200 µm; *p = 0.0220, Mann–Whitney test. D, Neurons harvested at DIV7 and cell extracts analyzed by Western blotting for GABARα1 and GADPH expression. Quantification of GABARα1 was normalized to GAPDH expression. Results (mean ± SEM) are expressed as percentage of Ct (n = 5, N = 2); *p = 0.0197, Student’s t test. E, Representative I-V traces (from −90 to +60 mV repeated every 0.1 s) through APP+/+ (A) and APP−/− (B) neurons, in the presence 100 μm GABA (red traces). F, Pooled data of whole-cell current (at +50 and −50 mV) evoked by 100 mm GABA, through APP WT and KO neurons. Each column represents mean ± SEM of n = 8 cells.

