
Figure 6.
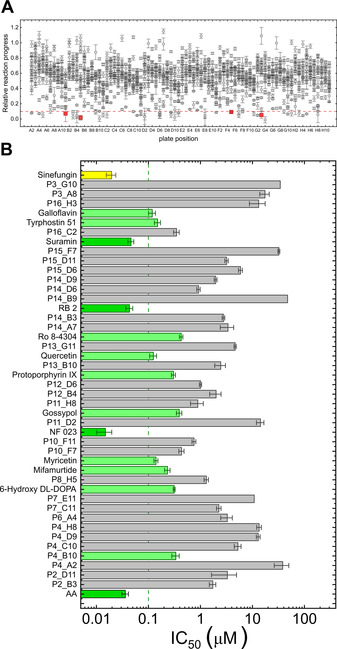
A) Relative reaction progress of Ecm1‐catalyzed N7‐methylation of probe 6 b in the presence of 1280 compounds from the LOPAC®1280 library. Data are the mean±SD of two independent experiments. Data point for four most potent found inhibitors are highlighted in red; B) IC50 values of selected compounds against Ecm1 N7‐MTase activity for 6 b (relative reaction progress ≤10 %) and sinefungin as a control. Dark green columns are for inhibitors with IC50 < 50 nm, light green for inhibitors with IC50 between 50 nm and 500 nm and yellow for sinefungin control. Data are the mean±SD of two or three independent experiments. The determined IC50 values are shown in Table S4.