
Figure 4.
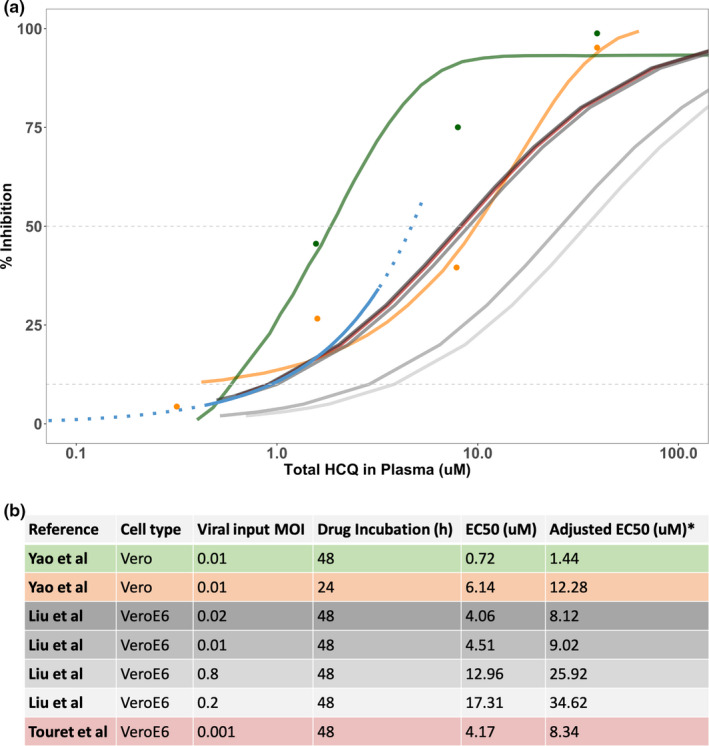
Comparison of EC50 values. (a) Comparison of percentage of viral inhibition for hydroxychloroquine (HCQ) by data source, including digitized 48‐hour in vitro data (green), 24‐hour in vitro data (orange) obtained from Yao et al., 3 in vitro data from Liu et al. 9 and Touret et al., 10 and longitudinal clinical data (blue; solid line = available data; dashed line = extrapolated data. Raw data and curves from Yao et al. 3 were digitized and displayed directly in the plot. The model used for these data is shown in the original manuscript and used a sigmoidal concentration‐response function . For the recently added references (Liu et al. 9 and Touret et al. 10 ), a Hill coefficient equal to 1 was assumed, and the different points for plotting purposes were calculated from the half‐maximal effective concentration (EC50) values provided in the original manuscripts. (b) Table including the EC50 values and in vitro experimental conditions from Yao et al., Liu et al., and Touret et al. 3 , 9 , 10 *Adjusted EC50 was calculated to obtain the total drug value as follows: , where fu = 0.5.