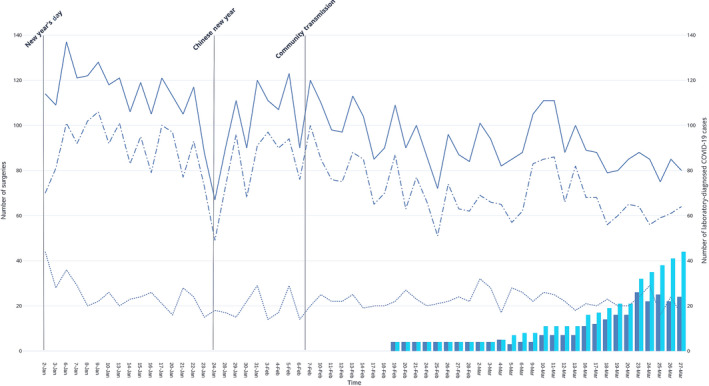
Figure 1.

Reduction of daily total (solid line), elective (dots and dashes) and emergency (dotted line) surgical case‐load in relation to number of admitted (blue bars) and cumulative total (teal bars) coronavirus disease 2019 patients. Elective surgeries are not performed on weekends and national holidays, which have been omitted from the x‐axis. ( ) Total surgeries; (
 )Elective surgeries; (
 )Emergency surgeries; (
 ) Admitted COVID‐19 patients; (
 )Cumulative total COVID‐19 patients.
