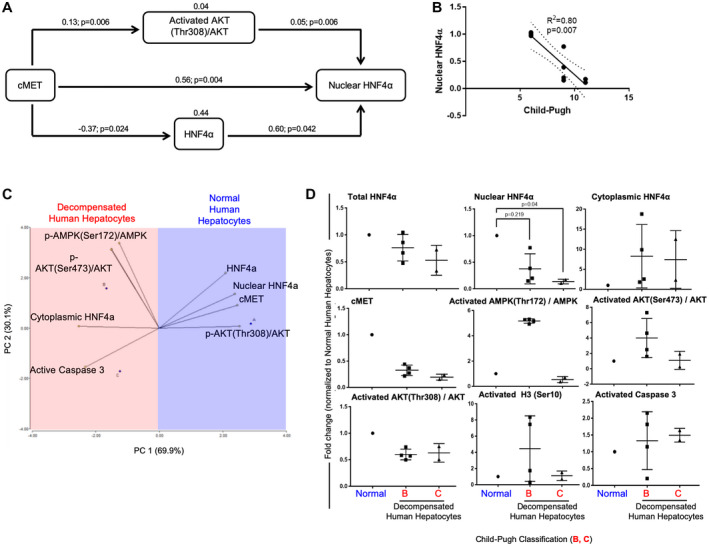
Fig. 6.

Relationship of PTMs and HNF4α cellular localization. (A) Schematic diagramming of the path analysis performed with protein expression revealed a significant direct relationship between nuclear HNF4α and cMET (0.56; P = 0.004), activated AKT(Thr308)/total AKT ratio (0.05; P = 0.006), and total HNF4α levels (0.60; P = 0.042). Path analysis also shows a negative significant relationship between cMET and total HNF4α (−0.37; P = 0.024). (B) Linear regression graph analysis shows the significant relationship of nuclear HNF4α expression and the degree of liver dysfunction (Child‐Pugh score) (R2 = 0.80, P = 0.007). (C,D) PCA and dot plots of the protein profile showing correlations with hepatocyte functional characteristics. cMET, activated AKT(Thr308)/total AKT ratio, and total and nuclear HNF4α expression positively explain the characteristics of healthy human hepatocytes (n = 2), whereas cytoplasmic HNF4α, active caspase 3, activated AKT(Ser473)/total AKT ratio, and p‐AMPK(Ser172)/AMPK explain the characteristics of decompensated human hepatocytes from NASH (n = 4) and alcohol‐mediated Laennec's cirrhotic livers (n = 2). (D) Dot plots are shown as the mean ± SD; P < 0.05.
