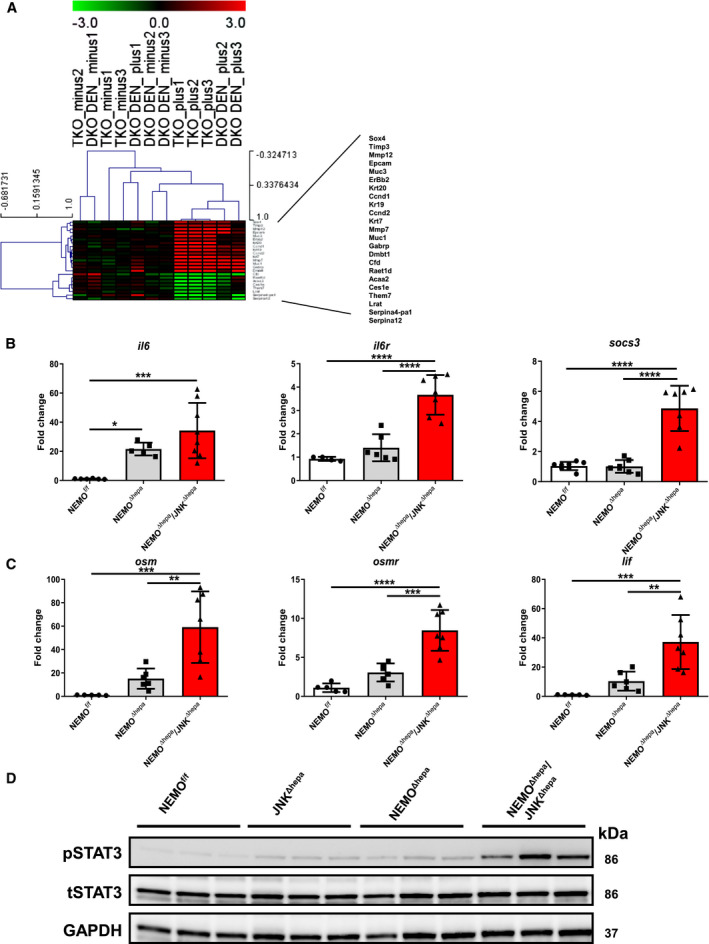
Fig. 4.

The IL‐6/STAT3 pathway is pivotal in biliary cell proliferation during liver carcinogenesis. (A) Gene array analysis was performed in 8‐week‐old NEMOΔhepa/JNKf/f and NEMOΔhepa/JNKΔhepa livers in addition to 26‐week‐old wild type and JNKf/f and JNKΔhepa livers challenged with DEN. Correlation of the fold induction of gene expression in liver is shown. Log2 expression values of the individual mice were divided by the mean of the NEMOΔhepa/JNKΔhepa mice. Log ratios were saved in a .txt file and analyzed with the Multiple Experiment Viewer. Top up‐regulated and down‐regulated target substrates are shown (red, up‐regulated; green, down‐regulated; n = 3, 3.0< fold change >3.0). (B) mRNA expression analysis of il6 (left); il6r (center), and socs3 (right). (C) mRNA expression analysis of osm (left), osmr (center), and lif (right) was quantified by qRT‐PCR of samples taken from NEMOf/f, NEMOΔhepa, and NEMOΔhepa/JNKΔhepa livers killed at 52 weeks. (D) Protein expression levels of STAT3 and pSTAT3 from whole‐liver extracts of 52‐week‐old NEMOf/f, JNKΔhepa, NEMOΔhepa, and NEMOΔhepa/JNKΔhepa mice were analyzed by western blot with the indicated antibodies. GAPDH served as loading control. Abbreviations: DKO, JNK1f/f/JNK2−/− + DEN; LIF, leukemia inhibitory factor; osmr, oncostatin M receptor; TKO, NEMOΔhepa/JNKΔhepa.
