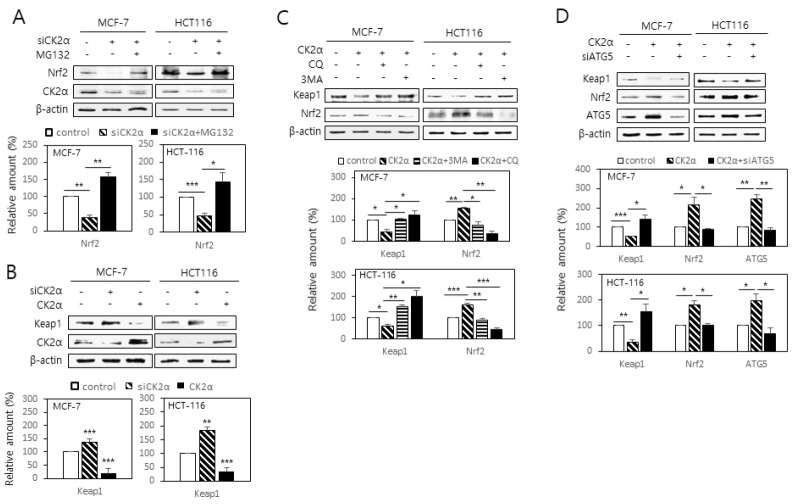
Fig. 3.
CK2 downregulation stimulates proteasomal degradation of Nrf2 via increasing Keap1 stability. (A) Cells were transfected with CK2α siRNA in the presence or absence of the proteasome inhibitor MG132 (10 μM). (B) Cells were transfected with CK2α siRNA or pcDNA-HA-CK2α for 48 h. (C, D) Cells were transfected with pcDNA-HA-CK2α in the presence or absence of the autophagy inhibitor chloroquine (CQ, 100 μM), 3-methyladenine (3-MA, 1 mM) (C), or ATG5 siRNA (D). Cells were lysed and electrophoresed on a 10% SDS–polyacrylamide gel. Protein bands were visualized by immunoblotting (upper panels). Graphs show the quantification of the protein levels relative to β-actin level (bottom panels). All data are shown as means ± SEM. *P < 0.05; **P < 0.01; ***P < 0.001.

