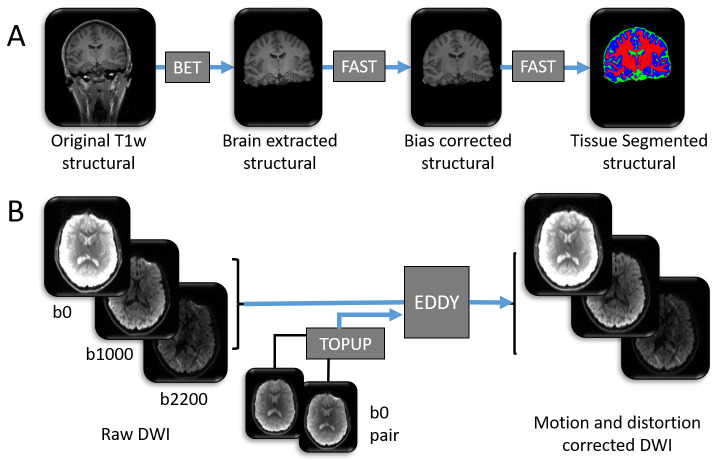
Figure 1. Graphical representation of the structural MRI data analysis pipelines.
A summary of the data processing tools used to prepare the ( A) T1 weighted image and ( B) diffusion weighted image for further analysis. Blue arrows denote pre-processing steps using freely available online tools (named within dark grey boxes). All pictures are of 3 dimensional images from one participant, and represent examples of input and output data files. As part of process ( A), each high resolution T1 weighted structural image has (i) non-brain tissue removed using BET, (ii) spatial intensity variations (RF field inhomogeneity) corrected using FAST and (iii) brain tissue types automatically labelled to one of either grey matter, white matter or cerebrospinal fluid (CSF) using FAST. Blue = grey matter, red = white matter, green = CSF. High resolution structural images are shown in greyscale. Note: this figure does not contain all input files and options required for each tool. For a comprehensive list of inputs, see the scripts that accompany this analysis 70.

