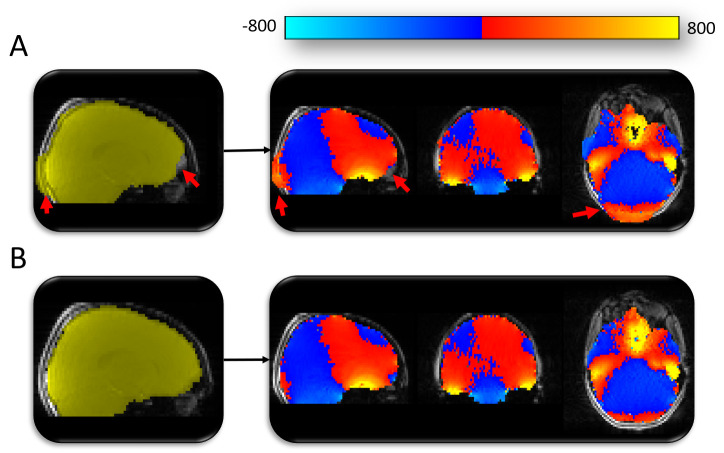
Figure 3. Manual editing of masks for creating fieldmaps.
( A) Automated mask generated using BET (shown in yellow). The automated methods used to mask the fieldmap magnitude image were producing sub-optimal results (highlighted by red arrows). Fieldmap image (blue-red-yellow image) generated using the sub-optimal mask would leave distortion-susceptible brain regions without appropriate distortion correction (e.g. red arrow in frontal lobe region). ( B) Mask following manual editing (yellow) and the subsequent fieldmap (blue-red-yellow) with appropriate coverage of distortion-susceptible regions.

