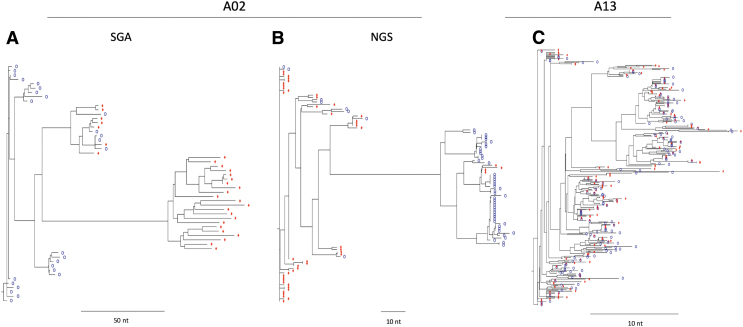
FIG. 2.
Phylogenetic trees generated from SGA (A) and NGS (B) sequence data showing virus compartmentalization in participant A02. An example of a phylogenetic tree showing equilibration between CSF-derived (blue circles) and blood-derived (red diamonds) virus (C). NGS next-generation, sequencing; SGA, single-genome amplification.

