FIG. 5.
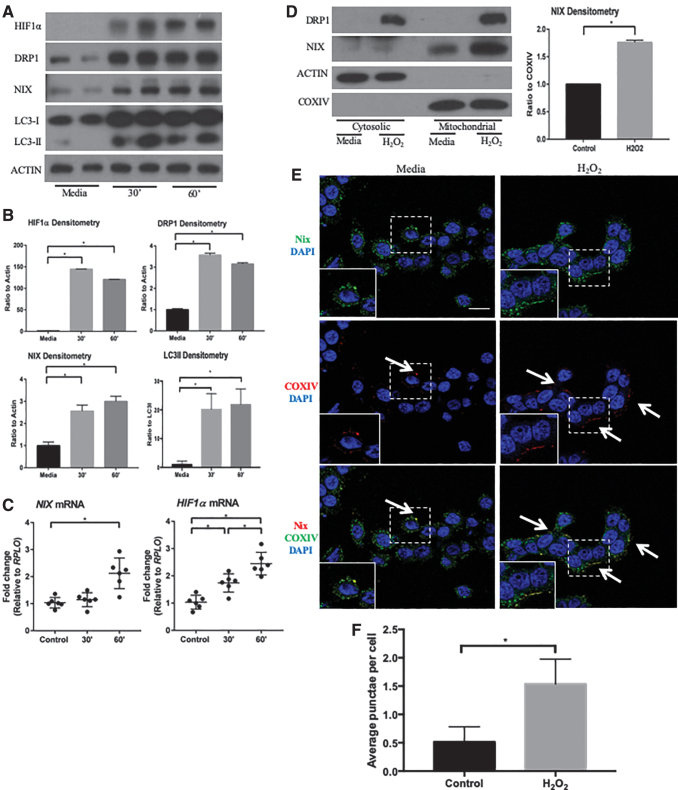
ROS stimulates HIF1α/NIX pathway in vitro. (A) Protein lysates of control and 10 μM hydrogen peroxide-treated cells were analyzed by Western blot, showing an increase in HIF1α, DRP1, NIX, and LC3 after 30 and 60 min. Blots shown are representative of several experiments (n = 2 for all groups). (B) Densitometry analysis highlights upregulation of HIF1α, DRP1, NIX, and LC3II/LC3I (n = 4 for all groups). (C) qPCR analysis showed an upregulation of NIX and HIF1α after 60 min of hydrogen peroxide treatment (n = 6 for all groups). (D) HT-29 protein lysates were separated into cytosolic and mitochondrial fractions, showing an accumulation of NIX in the mitochondria of hydrogen peroxide-treated cells for 1 h. Densitometry of NIX expression in mitochondrial fractions compared with COXIV depicts increased expression of NIX in hydrogen peroxide-treated cells (n = 2 for all groups). (E) HT-29 cells were treated with hydrogen peroxide for 60 min and stained by immunofluorescence for COXIV (green), NIX (red), and DAPI (blue). Immunofluorescence shows an increase in the protein levels of NIX and increased co-localization of NIX with COXIV in treated cells (n = 3/group; scale bar = 1 μm; arrows highlight areas of co-localization). Images are representative of three experiments. (F) The number of co-localized punctae per cell were counted, showing an increase in the hydrogen peroxide-treated cells (at least 50 cells/group per experiment were counted; n = 3/group). *p ≤ 0.05. ROS, reactive oxygen species.

