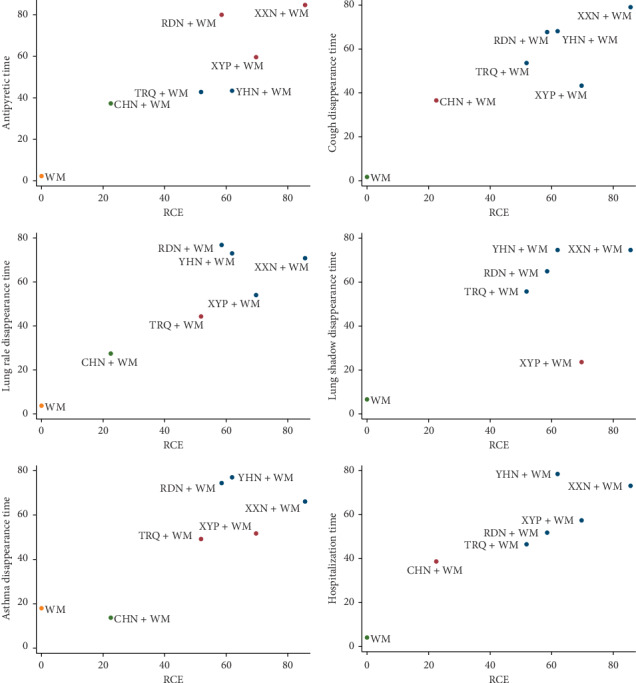
Figure 5.

Cluster analysis plots for seven outcomes. Interventions with the same color belonged to the same cluster, and interventions located in the upper right corner indicate optimal therapy for two different outcomes. RDN, Reduning injection; TRQ, Tanreqing injection; XXN, Xixinnao injection; XYP, Xiyanping injection; YHN, Yanhuning injection; CHN, Chuanhuning injection.
