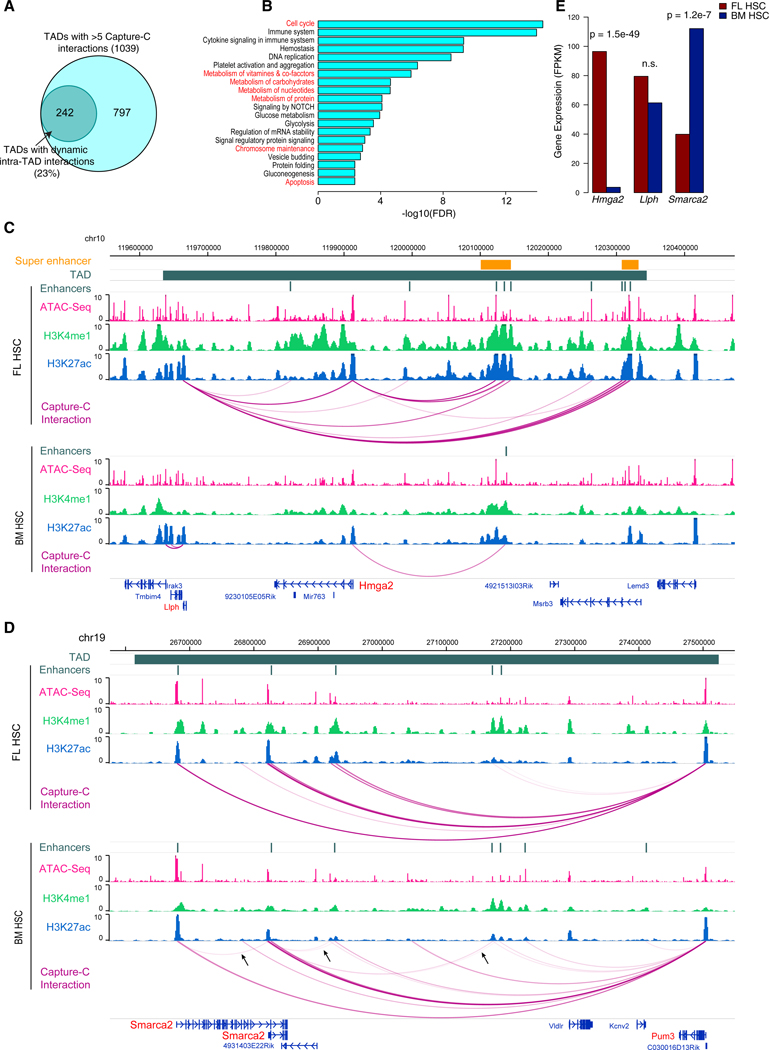
Figure 2. Intra-TAD Promoter-Centric Interactions Exhibit Large Dynamics.
(A) Venn diagram of TADs with dynamic intra-TAD interactions during fetal-to-adult HSC transition.
(B) Enriched GO terms among genes in the TADs with dynamic intra-TAD interactions.
(C) An example TAD with more promoter-centric interactions in FL HSCs than BM HSCs. Gene promoters with Capture-C baits are highlighted in red. TAD is indicated with a navy green bar. The normalized signals of ATAC-Seq, H3K4me1, H3K27ac, and Capture-C are displayed for FL HSCs (upper tracks) and BM HSCs (lower tracks). Two super enhancers are indicated with an orange bar.
(D) An example TAD with more promoter-centric interactions in BM HSCs than FL HSCs (indicated by arrows).
(E) Expression levels of three genes, Hmga2, Llph, and Smarca2 in the TAD. p value for differential expression was computed using the edgeR software.

