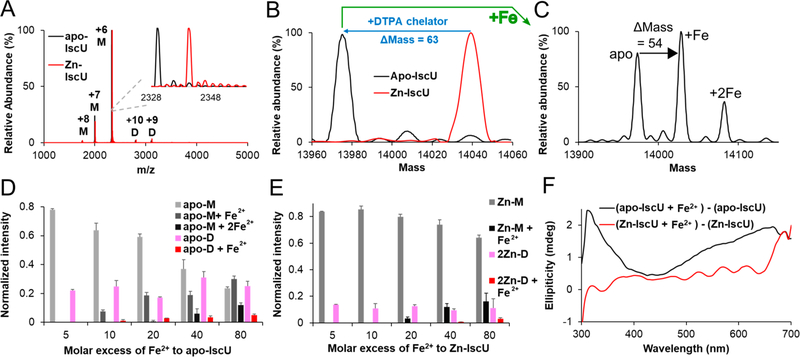
Figure 1.
Binding of Zn2+ and Fe2+ ions to IscU. (A) Raw native MS spectrum of apo–IscU (black) overlaid with as-isolated (Zn-bound) IscU (red). The +6, + 7, and +8 charge states for monomeric IscU and the +9 and +10 charge states for dimeric IscU are shown (M: monomeric IscU, D: dimeric IscU). The inset shows the raw MS spectrum for the +6 charge state of monomeric IscU. (B) Deconvoluted zero charge MS spectrum for the +6 charge state of monomeric IscU. (C) Deconvoluted zero charge MS spectrum of 10 μM apo–IscU mixed with 800 μM Fe2+. Titration of Fe2+ to 10 μM apo–IscU (D) or Zn–IscU (E) monitored by native MS revealed up to two metal binding sites per IscU subunit. Both monomeric (apo-M or Zn-M) and dimeric (apo-D or 2Zn-D) forms of IscU were identified. The error bars are replicate errors (n = 3). (F) A CD spectroscopic feature at 315 nm develops upon the addition of 500 μM Fe2+ to apo–IscU (50 μM; black) but not to Zn–IscU (50 μM; red).

