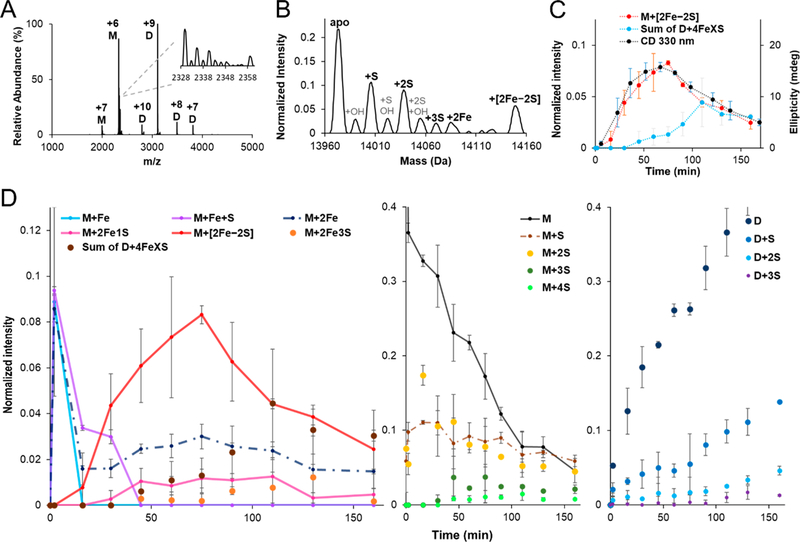
Figure 5.
Time-dependent tracking of intermediates in Fe–S cluster formation by native MS. (A) Representative raw and (B) deconvoluted zero charge MS spectra collected during cluster formation reactions. The inset of (A) shows the raw MS spectrum for the +6 charge state of monomeric IscU (M: monomeric IscU, D: dimeric IscU). Experimental conditions: 100 μM apo–IscU, 3 μM IscS, 200 μM L-cysteine, 100 μM GSH, and 250 μM ferrous acetate. (C) Comparison of the kinetics of [2Fe–2S]–IscU formation from native MS (normalized intensity; orange) and the CD spectroscopic signature at 330 nm (ellipticity; blue). The decay of the native MS [2Fe–2S] cluster signal corresponded to the development of four iron species (gray). The error bars are replicate errors (n = 2). (D) Normalized intensity of iron (left panel), non-iron monomeric IscU (middle panel), and non-iron dimeric IscU (right panel) related species displayed as a function of time. Proposed intermediates on the main pathway (see Figure 6) are shown with connecting solid lines. Additional proposed intermediates for viable secondary pathways are displayed with connecting dotted lines, whereas proposed off pathway species are shown without lines.

