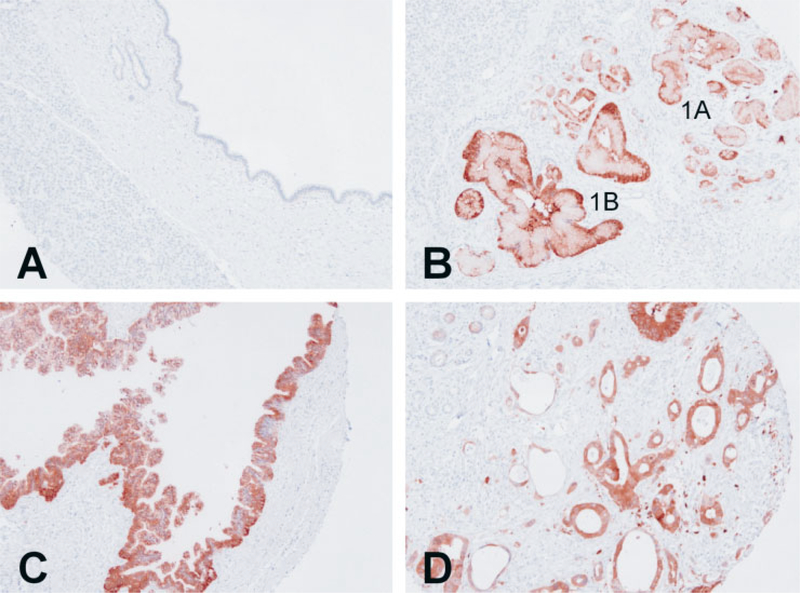
Figure 2.
Tissue microarray and NQO1 immunohistochemistry of pancreatic ductal tissue. (A) Representative field of tissue microarray that contained normal pancreatic ductal epithelium demonstrating no staining for NQO1. (B) PanIN-1A and PanIN-1B lesions demonstrating strong positive staining for NQO1. (C) Tissue microarray core of PanIN-2 lesion demonstrating strong positive staining for NQO1. (D) Representative field of pancreatic adenocarcinoma also demonstrating strong positive staining for NQO1.

