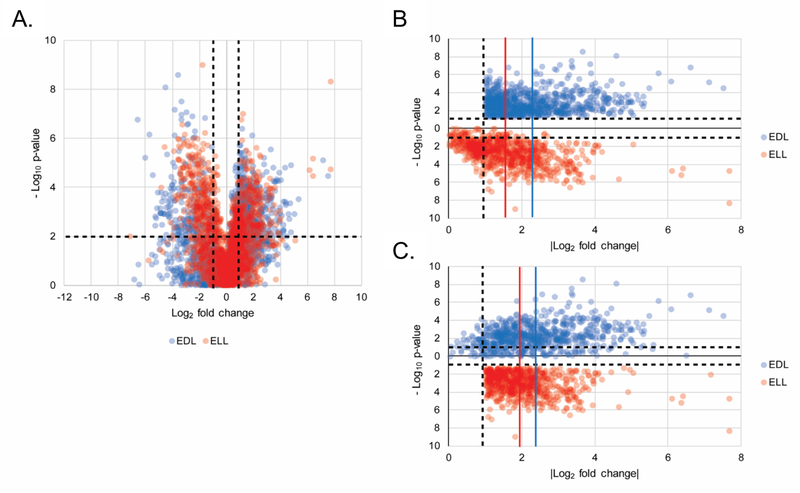
Figure 2. Differential metabolic changes between ELL and EDL patients vs HC.
22Volcano plot depicting the log2 fold change (x-axis) and –log10 p-value (y-axis) for the 2193 MFs (from the combined early Lyme disease vs HC biosignature) as compared to HC. MFs in EDL and ELL are plotted in blue and red, respectively, for replicate 1. The upper left quadrant contains 319 and 401 MFs and the upper right quadrant contains 605 and 378 MFs for EDL and ELL, respectively (A). A plot of |log2 fold change from HC| (x-axis) and –log10 p-value (y-axis) for the 924 MFs with >1 log2 fold change and p < 0.05 in the EDL vs HC comparison plotted for EDL (blue) and ELL (red) for replicate 1 (B). A plot of |log2 fold change| from HC (x-axis) and –Log10 p-value (y-axis) for the 779 MFs with > 1 log2 fold change and p < 0.05 in the ELL vs HC comparison plotted for EDL (blue) and ELL (red) for replicate 1 (C). The vertical blue lines depict the mean fold change (2.24 +/− 1.07 and 2.39 +/– 1.17 for B and C respectively) for EDL vs HC and the vertical red lines depict the mean fold change (1.55 +/– 0.97 and 2.03 +/– 0.86 for B and C respectively) for ELL vs HC.

