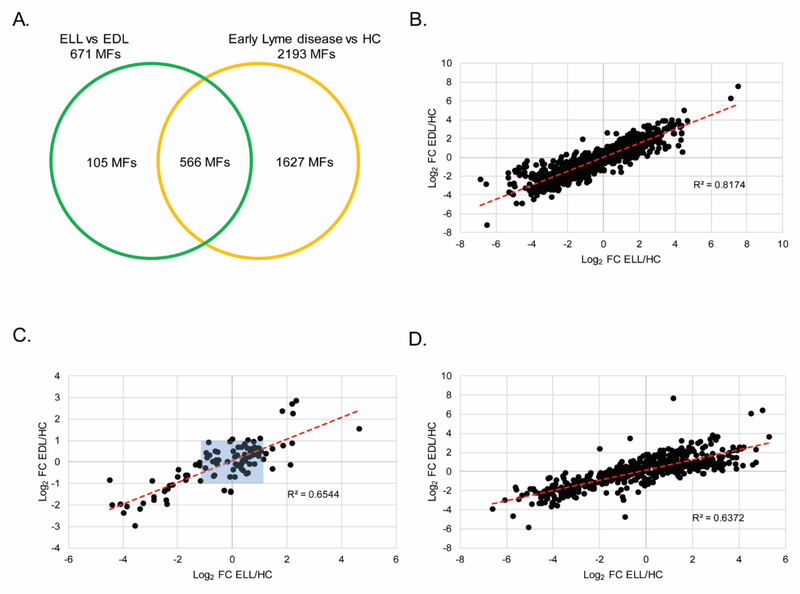
Figure 3. Metabolic changes between EDL and ELL patients.
A Venn diagram depicting the unique and overlapping features between the EDL vs ELL biosignature (671 MFs) and the early Lyme disease vs HC biosignature (2193 MFs) (A). Scatter plots for replicate 1 depicting log2 fold change from HC for EDL (x-axis) and log2 fold change from HC for ELL (y-axis) using the 1627 MFs unique to the EL vs HC biosignature (B); or the 105 MFs unique to the ELL vs EDL biosignature (C); or the 566 MFs in common between the early Lyme disease vs HC and the ELL vs EDL biosignatures (D). The red dotted line is the line of best fit. Blue shaded box indicates 66 out of 105 MFs with a |log2 fold change| of ≤ 1 from HC for EDL and ELL.

