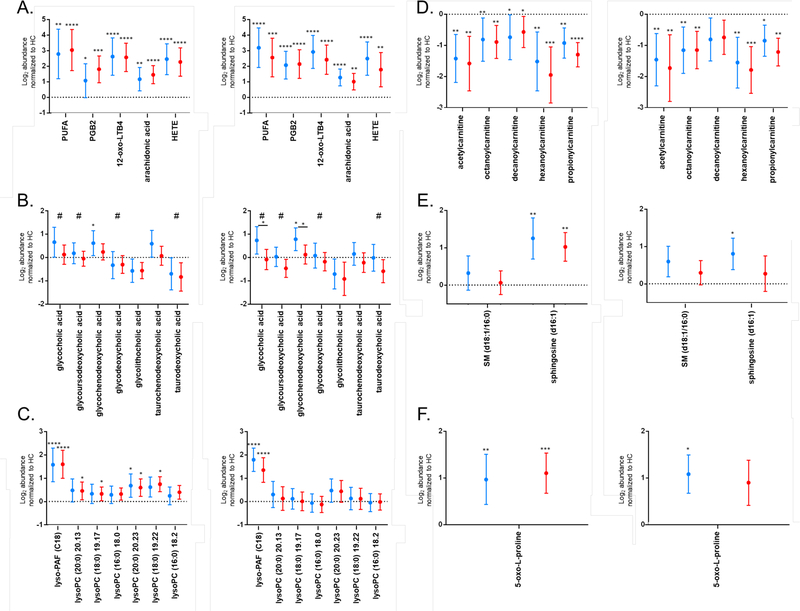
Figure 5. Directed Analysis of Pathways in Validation Samples.
Log2 abundances normalized to HC in ELL (red) and EDL (blue) patients for early Lyme disease vs HC biosignature MFs classified as eicosanoids (A), bile acids (B), lyso-PAF and lysoPCs (C), acylcarnitines (D), sphingolipids (E), and 5-oxo-L-proline (F) for replicate 1, left and replicate 2, right. Metabolites that were present on the ELL vs EDL biosignature list are noted with #. Data is presented as the mean +/− 95% confidence interval. Dotted line at zero indicates HC baseline. Significance between the patient cohort and HCs is indicated by: *, p < 0.05; **, p < 0.01; ***, p < 0.001, ****, p < 0.0001. Panel B significance (p < 0.05) between ELL and EDL is indicated by * over a solid line between the groups.

