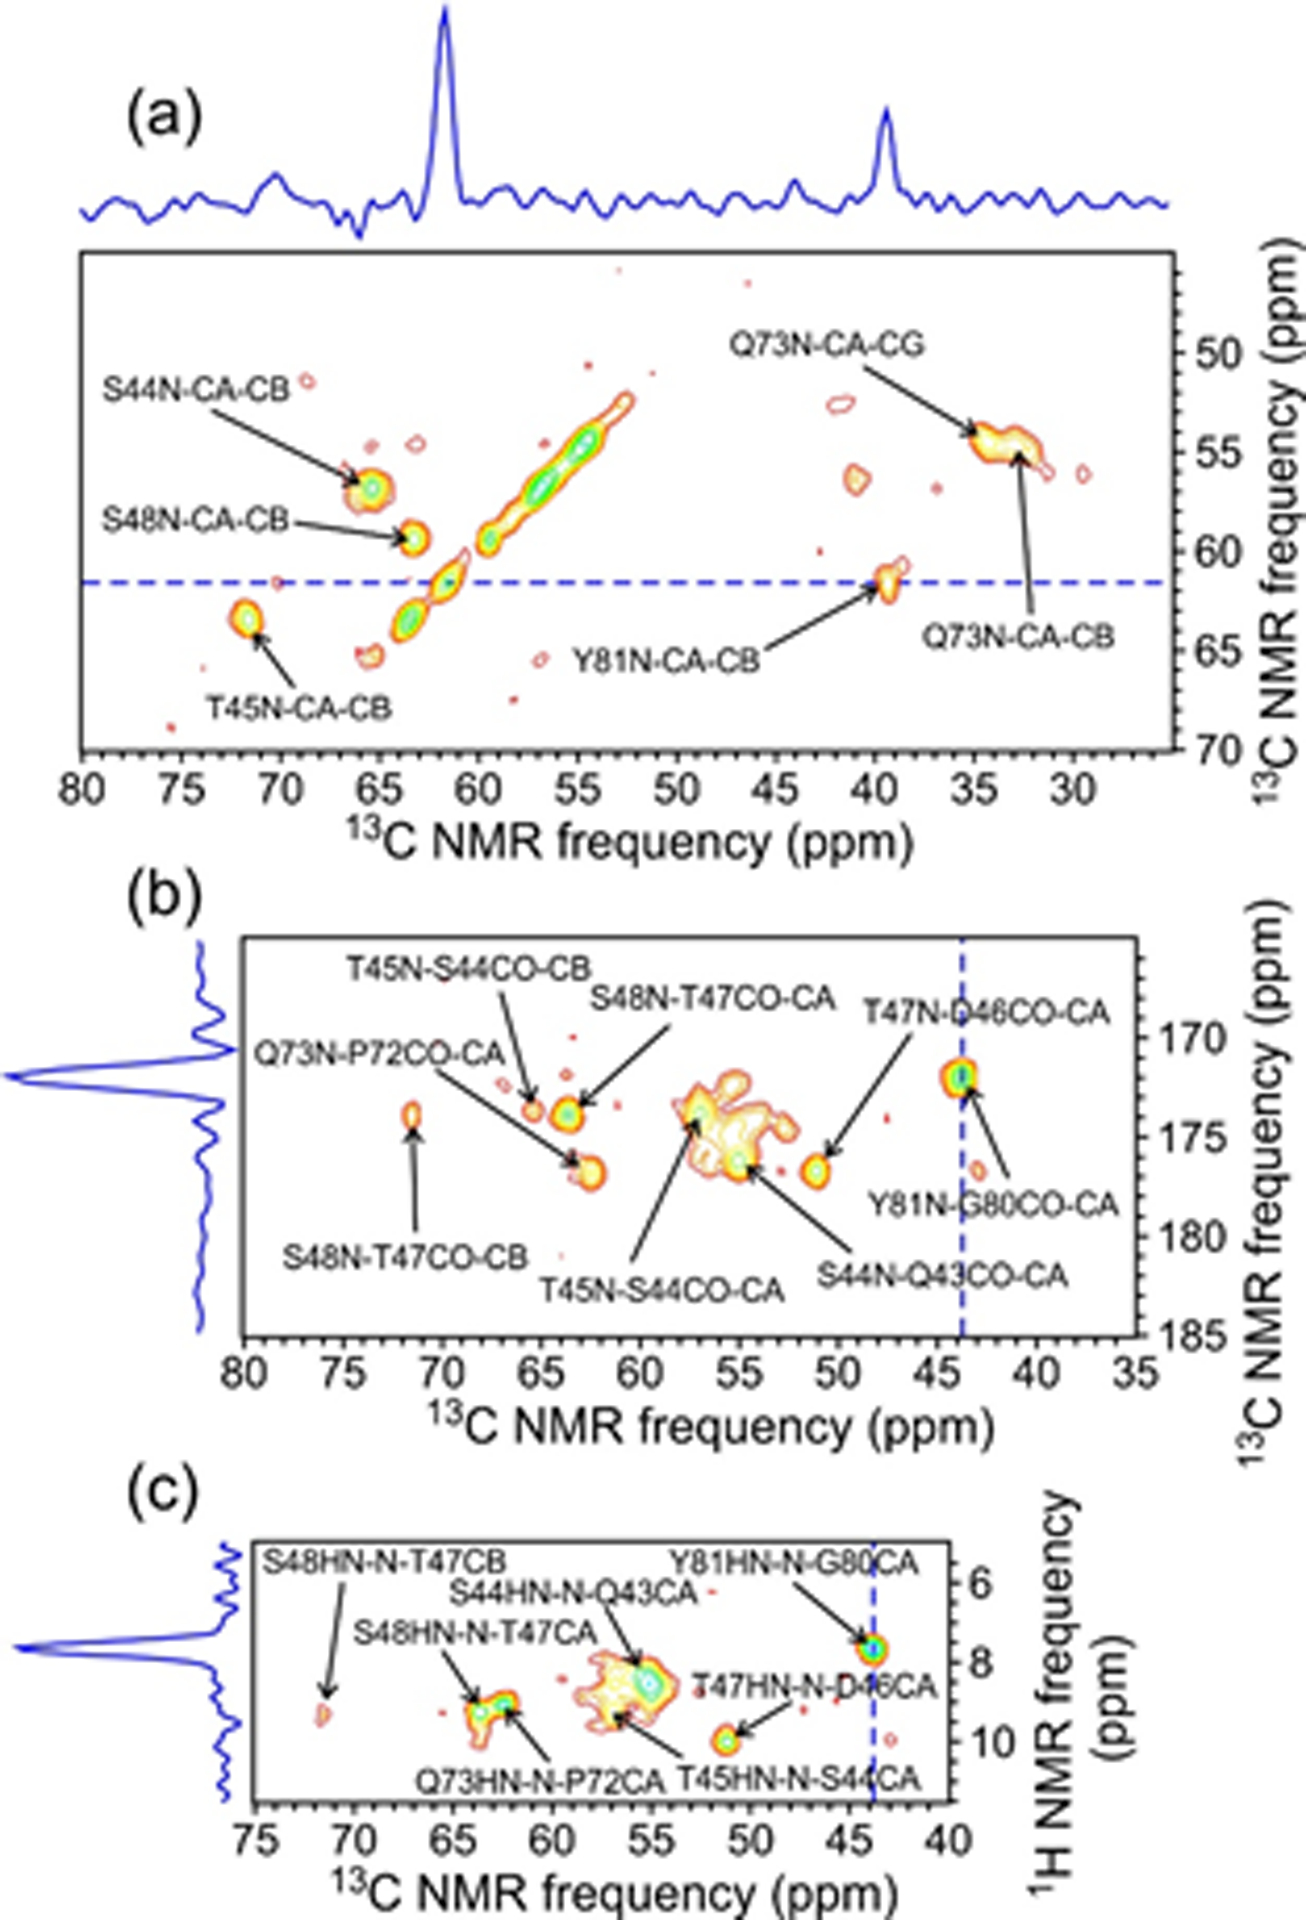
Figure 2:

2D planes from 3D NCACX (a), NCOCX (b), and HN(CO)CX (c) spectra of 2H,15N,13C-FUS-LC fibrils, taken at a 15N chemical shift of 121.4 ppm. Assignments are shown for crosspeaks with maxima within ±0.8 ppm of 121.4 ppm in the 15N dimension. Contour levels increase by successive factors of 1.4. 1D slices shown above or on the left side of the 2D planes correspond to the dashed blue lines and illustrate the signal-to-noise ratios and ssNMR linewidths in the 3D spectra. Spectra were acquired at 14.1 T with 40.00 kHz MAS. (Note that the NCACX and NCOCX planes are different sections of the same 3D 15N-13C-13C spectrum.)
