
Figure 3:
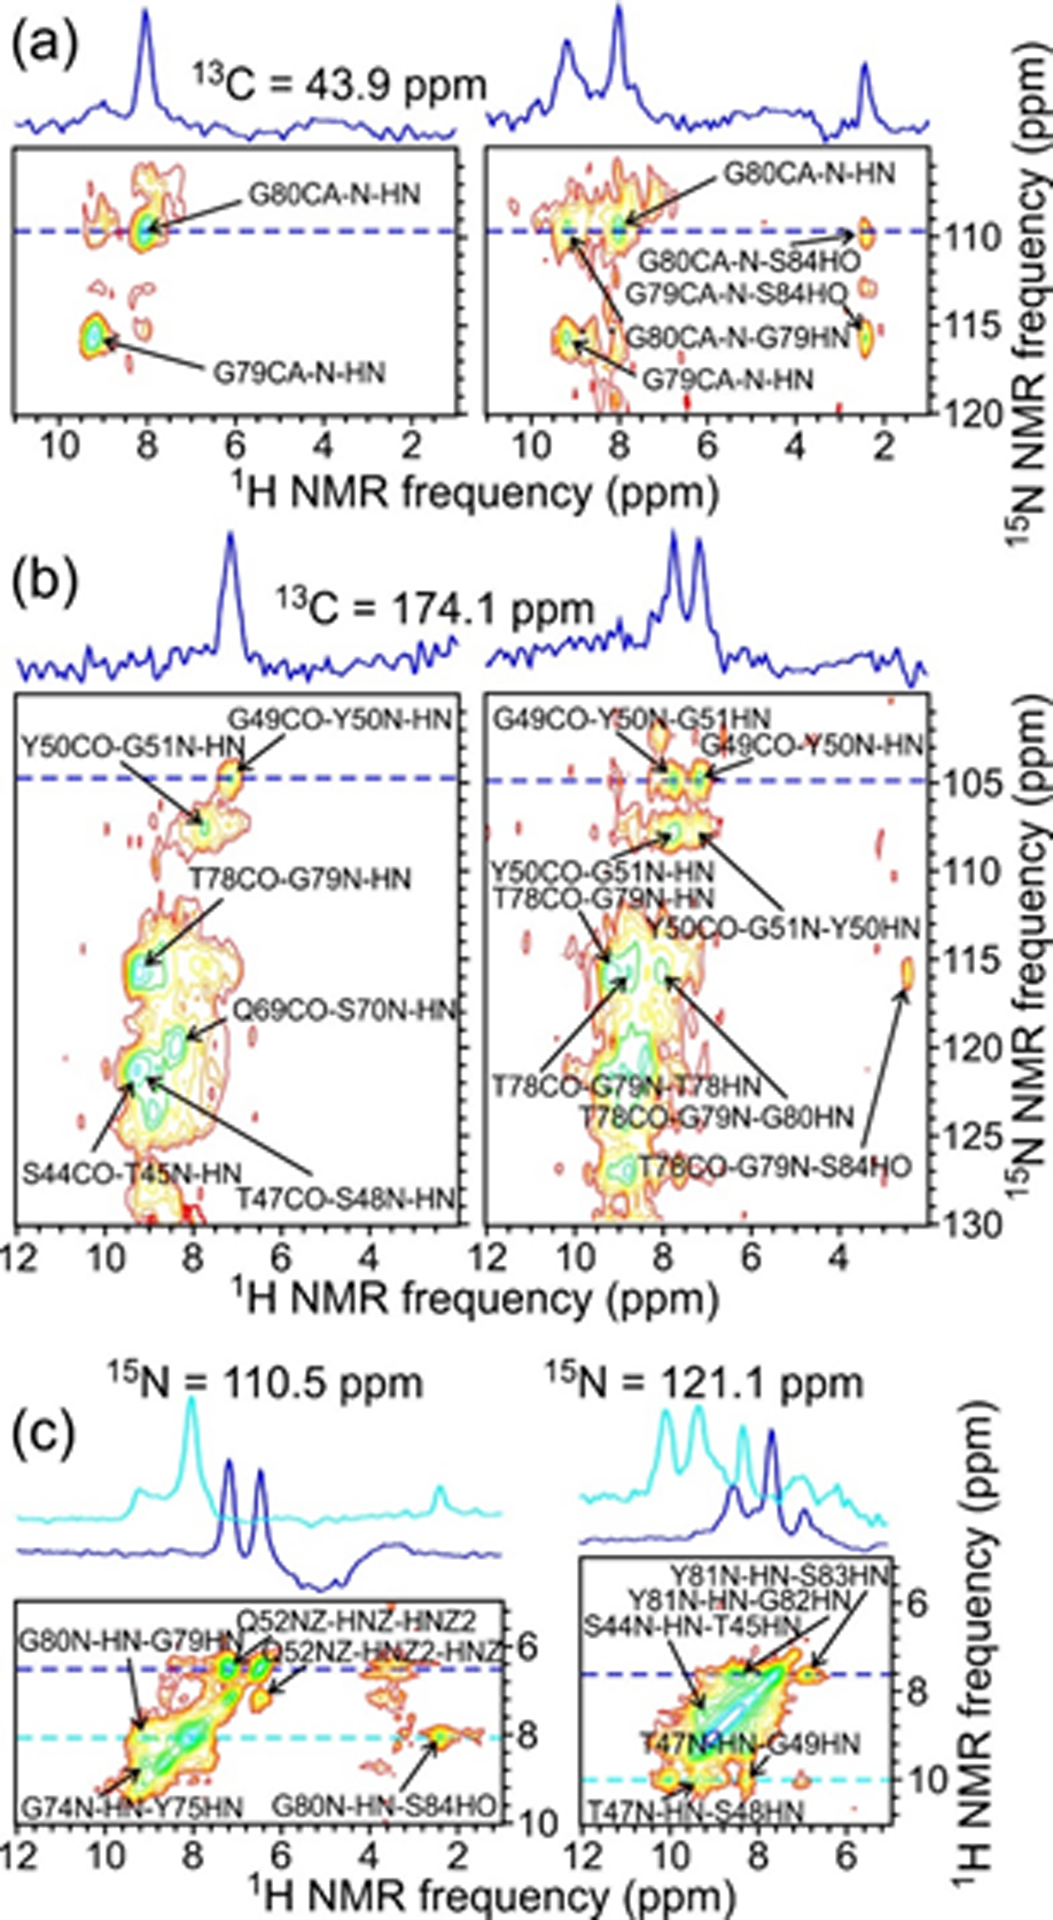
2D planes from 3D CANH and CAN(H)H spectra (a, left and right, respectively), 3D CONH and CON(H)H spectra (b, left and right, respectively), and a 3D NHH spectrum (c) of 2H,15N,13C-FUS-LC fibrils. Assignments are shown for crosspeaks with maxima within ±0.3 ppm of 43.9 ppm in the 13C dimension in panel a, within ±0.4 ppm of 174.1 ppm in the 13C dimension in panel b, and within ±0.6 ppm of 110.5 ppm (left) or 121.1 ppm (right) in the 15N dimension in panel c. Contour levels increase by successive factors of 1.4. 1D slices shown above the 2D sections correspond to the dashed blue and cyan lines. In panels a and b, these slices illustrate the development of additional inter-residue crosspeaks from 1H-1H spin polarization transfers in the CAN(H)H and CON(H)H measurements. Spectra were acquired at 14.1 T with 40.00 kHz MAS.