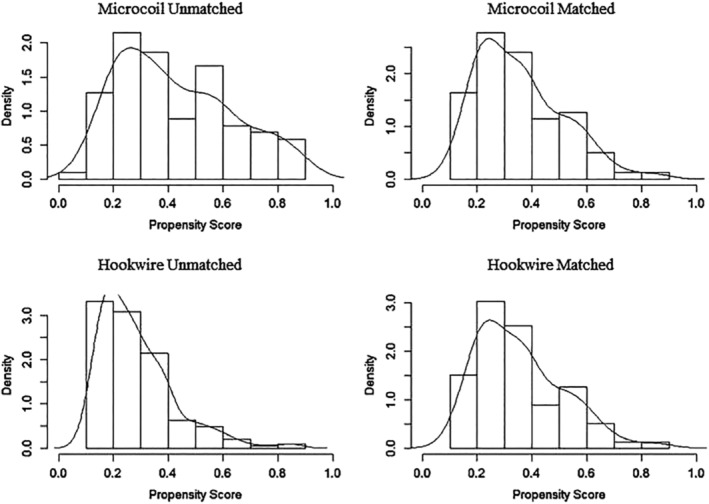
Figure 4.

Tendency score distribution histogram. (a and c) PS histograms of the microcoil group and (b and d) the hookwire group. After matching (c and d), the histograms of the PS distributions in the two groups were similar, suggesting a good match.
