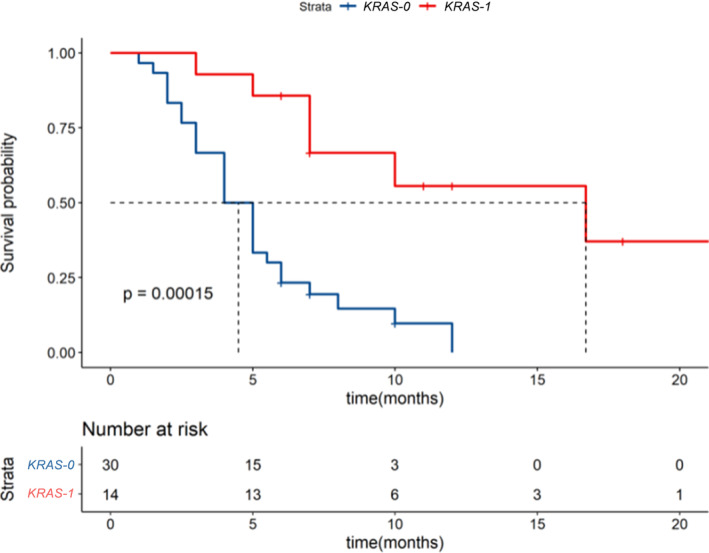
Figure 6.

The Kaplan‐Meier method was used to draw a progression‐free survival curve for NSCLC patients with or without the KRAS gene mutation ( ) Strata, (
 ) KRAS = 0, (
 KRAS = 1).

The Kaplan‐Meier method was used to draw a progression‐free survival curve for NSCLC patients with or without the KRAS gene mutation ( ) Strata, (
 ) KRAS = 0, (
 KRAS = 1).