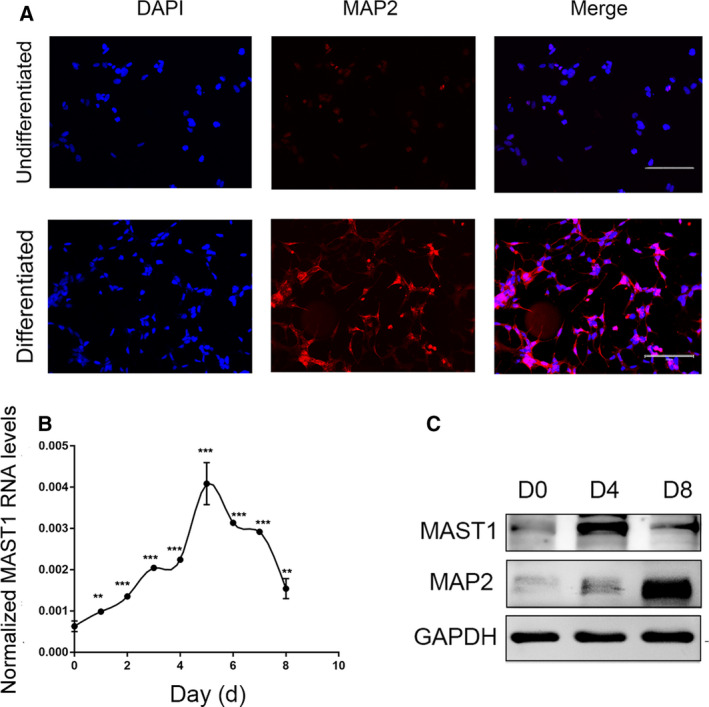
Fig. 1.

Induced expression of MAST1 during SH‐SY5Y cell neuronal differentiation. (A) Monolayer undifferentiated and neuronally differentiated SH‐SY5Y cells which had cultured in the absence or presence of 10 μm RA for 8 days were immunostained with MAP2 (red fluorescence) antibody and DAPI (blue fluorescence). (B) RT–PCR analysis of MAST1 mRNA levels, normalized to β‐ACTIN, from different days of SH‐SY5Y cell neuronal differentiation. (C) Western blot analysis of protein expressions of MAST1 and the neuronal markers MAP2, from different phases of SH‐SY5Y cell neuronal differentiation. D, day. Scale bars, 200 μm. Data are depicted as means ± SD of at least three independent experiments. Statistical analysis was performed using one‐way ANOVA followed by the LSD post hoc test. **P < 0.01, ***P < 0.001 versus D0.
