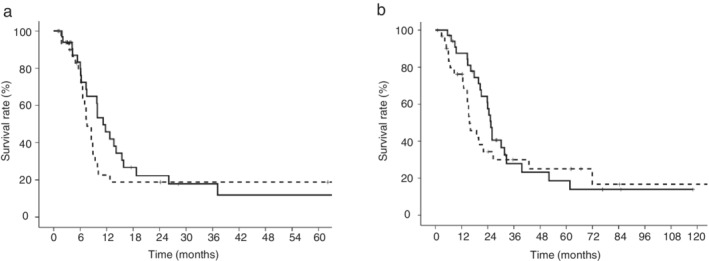
Figure 2.

Kaplan‐Meier curves according to the lung immune prognostic index (LIPI) in LD‐SCLC patients. (a) The median progression‐free survival (PFS) of the LIPI 0 group was not significantly different from that of the LIPI 1 plus 2 group (11.2 months vs. 7.6 months, respectively, P = 0.397) ( ) LIPI 0 group, (
 ) LIPI 1 plus 2 group. (b) The median overall survival (OS) of the LIPI 0 group was not significantly different from that of the LIPI 1 plus 2 group (25.5 months vs. 15.6 months, respectively, P = 0.383) (
 ) LIPI 0 group, (
 ) LIPI 1 plus 2 group.
