
Fig. 2.
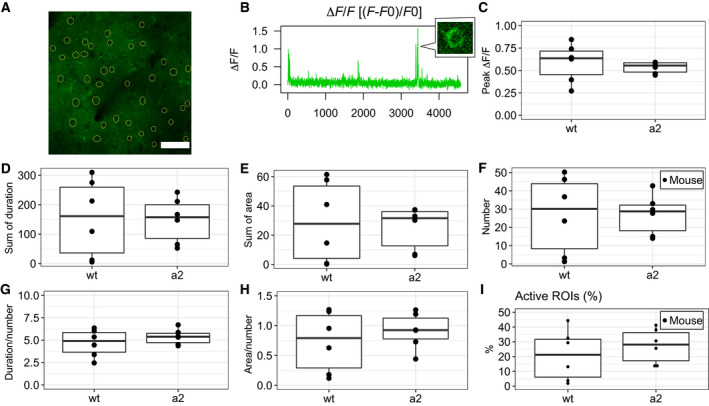
Spontaneous activity of neurons in the cortex. (A) Image of the cortex at a depth of 200 μm. Manually selected ROIs (yellow circles). Bar = 100 μm. (B) Data of ΔF/F calculated by (F − F0)/F0. A small window shows cells with increased fluorescence. (C) Peak ∆F/F of activity. (D) Sum of the duration of activity. (E) Sum of the area of activity. (F) Number of activities. (G) Duration divided by the number of activities. (H) Area divided by the number of activities. (I) Percentage of active ROIs. C‐I were not significantly different between wt mice (N = 6) and Atp1a2+/− mice (a2, N = 6).