Fig. 6.

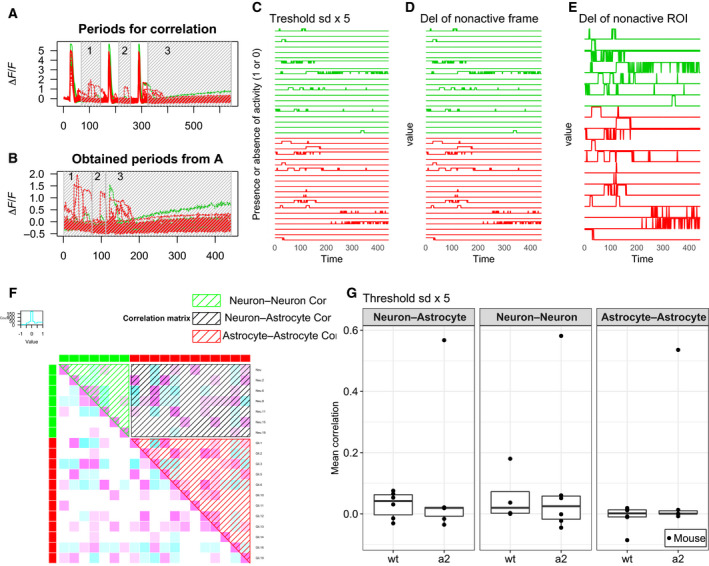
Activity correlation between ROIs. (A) Periods of analysis for activity correlations (gray shadowed box). Green signifies neurons. Red signifies astrocytes. (B) Obtained periods from (A). (C) The data are binarized according to the presence or absence of activity (1 or 0, respectively) from (B) by the threshold of the SD ×5. (D) Deletion of frames in which all ROIs were not active from (C). (E) Deletion of ROIs that did not show activity from (D). (F) Correlation matrix of (E). Green, red, and black shadowed boxes indicate correlation coefficients for neuron–neuron, astrocyte–astrocyte, and neuron–astrocyte pairs, respectively. (G) The mean correlations of wt mice (N = 6) and Atp1a2+/− mice (a2, N = 6) in each part of the matrix were plotted.
